Download
1 / 25
270 likes | 416 Vues
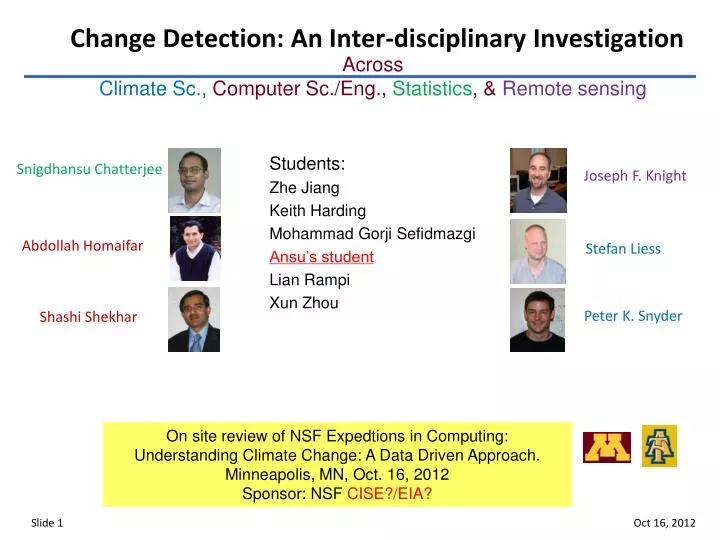
Change Detection: An Inter-disciplinary Investigation. Across Climate Sc., Computer Sc./Eng., Statistics , & Remote sensing. Students: Zhe Jiang Keith Harding Mohammad Gorji Sefidmazgi Ansu’s student Lian Rampi Xun Zhou. S ni gdhansu Chatterjee. Joseph F. Knight. Stefan Liess.

E N D
Change Detection: An Inter-disciplinary Investigation Across Climate Sc., Computer Sc./Eng., Statistics, & Remote sensing Students: Zhe Jiang Keith Harding Mohammad Gorji Sefidmazgi Ansu’s student Lian Rampi Xun Zhou Snigdhansu Chatterjee Joseph F. Knight Stefan Liess Abdollah Homaifar Peter K. Snyder Shashi Shekhar On site review of NSF Expedtions in Computing: Understanding Climate Change: A Data Driven Approach. Minneapolis, MN, Oct. 16, 2012 Sponsor: NSF CISE?/EIA?
Change Detection Questions in Climate Sc. Sahel: Characterize spatial Extent of the Sahel over time How does one define Savanna using remotely sensed data ? Identify appropriate variable to detect Sahel (and droughts) from among precipitation, soil moisture, vegetation, water supplies, etc. How does one efficiently find Sahel-footprint given Savanna definition How will statistical distribution of top k-percentile change? Regimes: How does one efficiently detect interesting interval in a time series? How does one detect persistent regime-intervals in time series collection?
Contributions to Computer Sc./Eng. & Statistics • Statistics: • Optimally detect change in multiple climate characteristics, their statistics, and relationship among these characteristics and variables, • Quantify the uncertainty and confidence in change detection, with incomplete, and spatio-temporally dependent • Computer Sc./Eng. • Efficiently discover Interesting sub-path from ST datasets: A Sub-path Enumeration and Pruning (SEP) approach • Spatial Decision Tree Learning algorithm (global spatial autocorrelation) • Finding common intervals of change among time series (need name of the approach/algorithm from Abbie’s group)
Computer Sc. Problem : Interesting Sub-path Query (ISQ) Input An interest measure and thresholds. A path and its attribute Output All dominant interesting sub-path Constraints Correctness & completeness Automation & scalability Unit interval : 1-2 2-3 3-4 4-5 5-6 6-7 7-8 8-9 9-10 10-11 11-12 Change : 7 -6 1 -1 5 5 4 -3 5 5 -11 Average change (slope) ≥ 3.5 [1,2], [5,11] Slope = 7 Slope = 3.5
Computational Structure & A Naive Algorithm Naive approach : Phase 1: Collect qualifying sub-paths For each possible sub-paths, evaluate interest measure Phase 2: Identify dominant sub-paths by comparing pairs of qualifying sub-paths. Will Dynamic Programming reduce computational cost? Start location Examined interval 1 2 3 4 5 6 7 8 9 10 11 12 Skipped interval 1 Invalid interval Dominated interesting sub-path 2 3 Dominant Interesting sub-path 4 End location 5 6 7 8 Dominated by 9 10 11 12 O(n4) in worst case
Why is ISQ Problem Hard? Concept Definitions Sahel Footprint: Rectangle or irregular polygon Interest Measure: Characterize Sahel signature in remotely sensed data Large Data Volume and Computations Trillion computations per time step for GIMMS/MODIS (resolution 0.07 degree) Thousand time steps per variable Non-monotonic Interest Measure Example: Average Slope (AS) AS (interval) does not bound AS (sub-interval) Dynamic programming principle violated Lack of (optimal) sub-structure
Computer Sc. Contributions for ISQ Problem Formalize Interesting (change) sub-path Query problem Characterized computational structure A novel algorithm: Sub-path Enumeration and Pruning (SEP) Evaluation Cost model Computational experiments Case study with Eco-climate data
Related Work, Its Limitations, Novelty of Our Approach Interesting sub-region query sub-paths e.g., SEP (Our Work) Change-points sub-regions (Future Work) e.g., CUSUM[3] [6] [1,2], [5,11] CUSUM score: S0 = 0, Sn+1 = max(0, Sn + xn - Ɵn) Here Ɵ is chosen to be the mean of the data Change below mean above mean
The SEP approach Insight 1 : Interest measure is a algebraic function Insight 2: Dominance imposes a partial order among sub-paths Insight 3: The partial order is a grid-based DAG Better way to traverse the G-DAG ? BFS? DFS (preorder)? DFS (postorder)? Start location 1 2 3 4 5 6 7 8 9 10 11 12 1 Start location 2 1-2 1-2 1 2 3 4 5 6 7 8 9 10 11 12 3 1 Traversal Direction SUM Cnt 4 1-12 2 1-2 1 7 5 End location 3 1-3 1 2 6 4 1-4 2 3 End location 7 5 1-5 1 4 8 6 1-6 6 5 9 5-11 7 1-7 6 11 10 8 1-8 7 15 11 5-11 9 1-9 8 12 12 10 1-10 17 9 11 5-11 1-11 22 10 1-2 12 1-12 12 11 • AVG = SUM/COUNT. • - Build lookup table for SUM and COUNT • - pre-compute for O(n), access for O(1) • Row-wise : scan each row, stop when pattern found • Top-down : Smart BFS over G-DAG • - A node has 2 parents: a pruned node may reappear! • - No phase 2 needed – more space for recording Grid-based Directed Acyclic Graph (G-DAG) 1-2 1-3 1-4 1-5 1-6 1-7 1-8 1-9 1-10 1-11 5-11 1-12 1-2 2-3 3-4 4-5 5-6 6-7 7-8 8-9 9-10 10-11 11-12
Backup slides start hereA Comparison of Techniques for Traversing G-DAG
Backup slides start hereGeneralizable contribution to computer science • New graph traversal order (for G-DAG) • Can benefit many other problems for scaling up to larger datasets • Space (e.g., spatial field data) • Time (e.g., time series) • Space-time (e.g., Lagrangian path?) • Trajectories • Hui’s paper (see if apply) • Space-filling curves are designed for traversing planar space not graph • Hillbert Hillbert curve (source: wikipedia)
Theoretical and Experimental Evaluations of SEP • Theoretical Evaluation: • SEP is Correct and Complete • Correct: All the reported sub-paths are qualifying dominant sub-paths • Complete: All the dominant interesting sub-paths are reported • Experimental Evaluation • SEP is orders of magnitude faster than competition • SEP top-down is faster for longer patterns • SEP row-wise is faster for shorter patterns Case 3: Row-wise vs. Top-down Case 2: long patterns PLR = 1 Case 1: short patterns (PLR = 0.1) * Synthetic dataset: length 10k-50k, unit difference follow Gaussian distribution. Code in Matlab. ** Pattern Length Ratio is the length of longest interesting sub-path by the length of the entire path, between 0 and 1.
Case Study (1) Data: Vegetation Data (in NDVI) by GIMMS [4], Africa, 1981 August. Resolution: 8km. Smoothed within 1x1 degree. Path: along each longitude (south north) Interest measure: (Slope)Sameness degree , ∆ : unit slope Thresholds:α= 20% percentile, SD ≥0.5 AVG{∆} AVG≥α{∆}
Case Study (2) The Sahara desert is growing towards south What is the spatial pattern of the Sahel over time Time: August, 1982-1985, 1990, 2000
(Path to) Contribution to Climate Science Current Identify the spatial extent of the Sahel and its change over time. Characterize existing land cover/use applicable to climate studies (e.g. savanna) Near Future: Understand Sahel Drought Occurrences Attribution: Human Influence Vs. natural processes Changes in intensity, location, frequency Tele-connections Predict future changes using projected climate information (CMIP5) How is regional climate changing (e.g., moisture content, evapo-transpiration, boundary layer energetics)? Characterizing changes in the general circulation and its affect on extreme events - detecting changes in Rossby wave amplitude and wave number Long Term Improve vegetation representation in climate simulations
Future research directions in Computer Sc. & Statistics Computer science directions Exploring two dimensional change patterns Two dimensional transitional zone (e.g., rectangle) Arbitrary change direction Exploring three dimensional change pattern Space-time change zone Reduce memory needs of the SEP algorithm Spatial Decision Tree Learning algorithm + local autocorrelation (from zhe) Statistics Future Directions Needs input from Ansu
List of Publications and References Contributors’ Publications: [1] Xun Zhou, Shashi Shekhar, Pradeep Mohan, Stefan Liess, Peter K. Snyder: Discovering interesting sub-paths in spatiotemporal datasets: a summary of results. GIS 2011: 44-53 [2] Need publications from Ansu, Abby and Joe’s group References: [3] E. Page. Continuous inspection schemes. Biometrika, 41(1/2):100--115, 1954. [4] Tucker, C. J., J. E. Pinzon, M. E. Brown. Global inventory modeling and mapping studies. Global Land Cover Facility, University of Maryland, College Park, Maryland, 1981--2006. [5]. Needs references from Ansu, Abby, and Joe’s group
Traversal order on the G-DAG (Top-down/smart BFS) 1-12 Grid-based Directed Acyclic Graph (G-DAG) 5-11 1-2
Traversal order on the G-DAG (Pruning bordar/smart DFS) 1-12 Grid-based Directed Acyclic Graph (G-DAG) 5-11 1-2
Backup slides start hereGeneral contribution to computer science • General contribution to computer science • New graph traversal order • Can benefit many other problems for scaling up to larger datsets • Space • Time • Space-time • Trajectories • Hui’s paper (see if apply) • Space-filling curves for space not for graph space • + pictures of Hillbert
What is a drought A period of unusually persistent dry weather that persists long enough to cause serious problems such as crop damage and/or water supply shortages Four different ways to define drought Meteorological-a measure of departure of precipitation from normal. Due to climatic differences, what might be considered a drought in one location of the country may not be a drought in another location. Agricultural-refers to a situation where the amount of moisture in the soil no longer meets the needs of a particular crop. Hydrological-occurs when surface and subsurface water supplies are below normal. Socioeconomic-refers to the situation that occurs when physical water shortages begin to affect people. sources: NOAA http://www.wrh.noaa.gov/fgz/science/drought.php?wfo=fgz
Desertification (1) Sahel is transition zone between the desert and Savannas. Arabic word Sahel means shore (coastline of Sahara desert) Sahel droughts have occur numerous time over centuries including 2012, 2010, 1984-85 (Ethiopia), 1968-73,1940s, 1910s, 1898, etc. Possible correlates include AMO, global warming/dimming, Solar(89-120 years) Wolf-Gleissberg cycles, overgrazing/deforrestation, land management practices, ... UN Convention to Combat Desertification shows a map of areas of high risk for dessertification. This map looks very similar to the map produced in our case study with vegetation data http://en.wikipedia.org/wiki/Desertification Deserification is the the process of fertile land transforming into desert typically as a result of deforestation, drought or improper/inappropriate agriculture Regards, A billion people are under threat from further desertification Sahara is currently expanding southward 48 km/year. desertification creates increasingly larger empty spaces over a large strip of land, a phenomenon known as "tiger fur pattern". Pictorial details of Sahel dessertification are at http://oceanworld.tamu.edu/resources/environment-book/desertificationinsahel.html
Desertification (2) Current decade (2010-2020) is UN decade Decade for Deserts and the Fight against Desertification. Last week, Colorado State U hosted a UN meeting on desertification. See http://www.today.colostate.edu/story.aspx?id=4888 It suggests that desertification is a key issue for US (West, Mid-west). A recent paper lists six research priorities including Increase understanding of the nature, extent and severity of desertification, drought and dryland degradation, and develop more effective ways to measure and monitor it. See page 8 , 12-13, 25-26 (Dust Bowl), 27-28 (Sahel) of Desertification, Drought, Poverty and Agriculture: Research Lessons and Opportunities, Mark Winslow et al, 2004.http://www.iwmi.cgiar.org/Assessment/files/Synthesis/Land%20Degradation/DDPAARLO_text.pdf Another report on desertification from 2009-2010 is atIDEntifying and Analysing New Issues in Desertification: Research Trends and Research NeedShttp://www.uni-marburg.de/fb02/ike/forschung/projekte/finalreport.pdf