Download
1 / 17
170 likes | 292 Vues
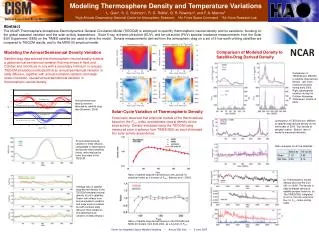
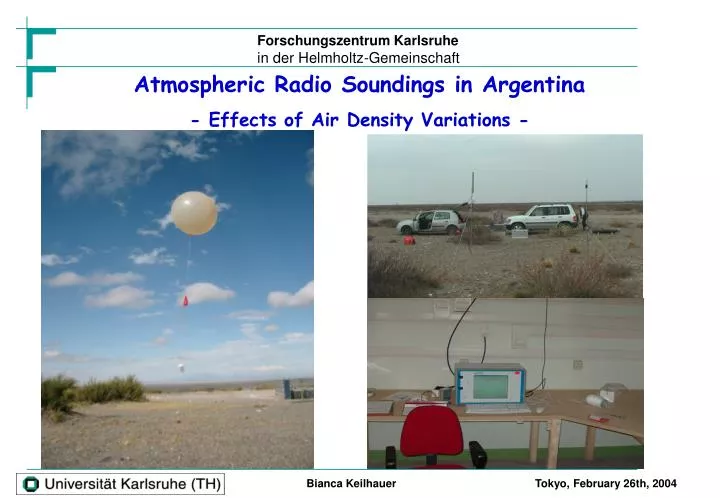
Forschungszentrum Karlsruhe in der Helmholtz-Gemeinschaft. Atmospheric Radio Soundings in Argentina - Effects of Air Density Variations -. Bianca Keilhauer. Tokyo, February 26th, 2004. Data Acquisition. Auger Fluorescence Detector measures longitudinal shower development

E N D
Forschungszentrum Karlsruhein der Helmholtz-Gemeinschaft Atmospheric Radio Soundings in Argentina - Effects of Air Density Variations - Bianca Keilhauer Tokyo, February 26th, 2004
Data Acquisition • Auger Fluorescence Detector measures longitudinal shower development • Atmospheric parameter affect the development and detection at every height • ⇒ Knowledge of atmospheric profiles is required • Radiosonde measurements in each season are performed: • 61 successful launches in total • Average reached altitude ≈ 20 km a.s.l. (maximum was 28 km a.s.l.) • Roughly every 20 m a set of data (h, p, T, u, wind) • Used DFM-97 GPS sondes (www.graw.de) • Accuracy: T < 0.2 K p < 1.0 hPa (range 200 hPa to 1080 hPa) < 0.5 hPa (range 5 hPa to 200 hPa) u < 5%
Important Effects of Atmospheric Profiles on the Auger FD shower data • Atmospheric depth to geom. height • Fluorescence light production • fl. yieldλ(p,T) • Fluorescence light transmission • τ (p,T) fluorescence photons X to h Fe p Fe p Fl. Yield transmission telescope atmosph. depth height
atmospheric depth: air density: ⇒height and time dependent height (km a.s.l.) 10 8 6 5 4 3 2 particle number (x 109) Geometrical Effect atmospheric depth (g/cm²) Fe p 1019eV / 0° US Std. atmosphere
Atmospheric Depth Profiles Max. of Fe-ind. 1019eV, 60o shower in US-StdA averaged measured profiles: • distortion of longitudinal shower profiles • shift of position of shower maximum
Difference in Atmospheric Depth within seasons winter, July / August 2003 summer, January / February 2003
Longitudinal Shower Development - Energy Deposit - average of 100 simulated showers ⇒ same EAS in Ne(X) for all atmospheres ⇒Δhmax= 436 m between winter I and summer atmosphere
Difference in Energy Deposit same EAS inNe(X) for all atmospheres
Fluorescence Yield for a 1.4 MeV electron, vertical incidence • EAS excites N2 – molecules in air • de-excitation partly via fluorescence light emission (λ≈ 300 -400 nm) • fl. yield ~ local energy deposit
both EAS 60°, 1019eV, p-ind. in summer, Fe-ind. in winter I: → Δhmax= 350 m vertical height difference 8.0 km 8.35 km both 8.1 km Position of Shower Maximum - Fluorescence Yield - both EAS in US-StdA, 60°, 1019eV: → Δhmax= 800 m vertical height difference 7.6 km 8.4 km same EAS inNe(X) for all atmospheres
Xmax distribution for Fe-ind. showers with 60° ⇒ increase of Xmax distribution by approx. 25 % same EAS inNe(X) for all atmospheres
Photons at the telescope Fe, 1019eV, 60°, same EAS inNe(X) for all atmospheres
Photons at the telescope Fe, 1019eV, 60°, same EAS inNe(X) for all atmospheres
Summary • Atmospheric conditions influence the:- Shower development - Fluorescence light emission - Light transmission • EAS profiles are shifted and distorted: - Xmax position - Energy reconstruction - Distribution of Xmax broadened in dependence of incidence angle (more important for Fe-ind. EAS than for p-ind. ) • Fluorescence yield is height and (p,T) - dependent
Difference of Atmospheric Depth Profiles for pressure at ground: 825.0 ± 0.2 hPa, 829.0 ± 0.2 hPa, 826.0 ± 0.2 hPa, 834.5 ± 0.2 hPa
Atmospheric Depth Distribution at 2400 m for the individual profiles measured in Argentina
Atmospheric Depth Distribution at 8400 m for the individual profiles measured in Argentina