Download
1 / 20
220 likes | 392 Vues
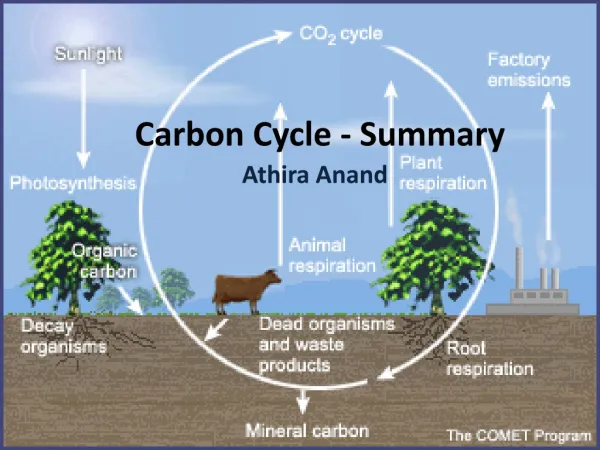
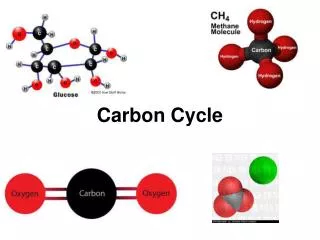
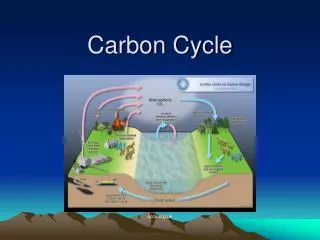
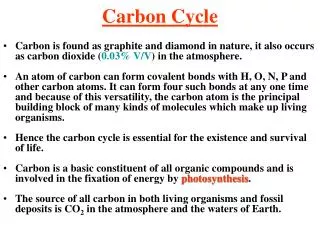
Carbon Cycle Modeling. Global Carbon Cycle. Carbon Budget: missing sink. Biosphere-atmosphere exchange: photosynthesis and respiration. 6 CO2 + 12 H2O + light → C6H12O6 + 6 O2 + 6 H2O Carbon Dioxide + Water + Light energy → Glucose + Oxygen + Water C6H12O6 + 6O2 → 6CO2 + 6H2O.

E N D
Biosphere-atmosphere exchange:photosynthesis and respiration • 6 CO2 + 12 H2O + light → C6H12O6 + 6 O2 + 6 H2O • Carbon Dioxide + Water + Light energy → Glucose + Oxygen + Water • C6H12O6 + 6O2 → 6CO2 + 6H2O
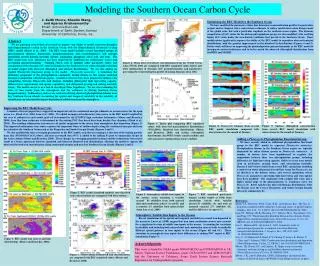
computed using the mean monthly distribution of sea-air pCO difference, the climatological NCEP 41-year mean wind speed. The yellow-red colors indicate a region characterized by a net release of CO to the atmosphere, and the blue-purple colors indicate a region with a net uptake of CO from the atmosphere. This map yields an annual oceanic uptake flux for CO of 2.2 ± 0.4 Pg C yr .
Annual national wood harvest aggregated to continental values, for 1700 – 2000. Total global integrated wood harvest 1700-2000 is 86 Pg C.
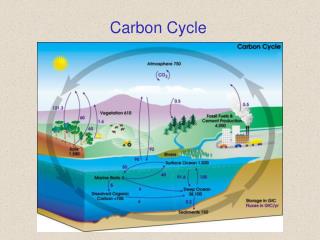
Modeler’s View of the Carbon Cycle Fossil Fuels Atmosphere CO2 = 280 ppmv (560 PgC) + FF 4yr 90± 60± Ocean Circ. + BGC Biophysics + BGC 100-102 yr 100-103 yr 2000 Pg C 37400 Pg C + FF …equilibrium takes 103-104 yrs
A Model • Model is a theoretical construct that represent a set of particular processes and phenomena • a set of variables – input, output, state, parameters • a set of logical and quantitative relationships between them • a set of assumptions • Idealized logical framework to test hypothesis and to ask scientific questions
CO2 change Lands use changes
Grid and Resolution • Gaussian • Lat x Lon • 2 ° x 2.5 ° • 1° x 1 ° • Time step: 30 Minutes • Simulation: centuries
LM3V Functionality • Land surface parameterization • energy, water, and momentum exchange • Hydrological processes • River flow, water resource development and use, extreme events • Ecological processes • vegetation functioning, structure, distribution, and disturbance (natural and anthropogenic) • Carbon cycling • CO2 fluxes, vegetation and soil carbon pool • Land use and management
Cumulative Discharge from Nov 1986 to Nov 1987 (log scale)in the New River Routing Model
Why do we need a model of vegetation dynamics and biogeochemical cycles?
Climate change Hypotheses for the terrestrial sink: 1. CO2 Fertilization 2. Climate Change 3. Land Use Solving the carbon problem is twice as hard if the missing sink is caused by land use instead of CO2 fertilization.
Nutrients delivery to the coasts Courtesy C. Vorosmarty, UNH
Scientific Questions • How did recent changes in climate, CO2 and land use shape the present day distribution of land carbon and nitrogen sources and sinks? • What are the influences of land cover changes on continental precipitation and runoff? • What are the implications of climate change for the distribution and functioning of terrestrial vegetation ? • What are the terrestrial biosphere feedbacks on climate? • What is the role of plants diversity in the global biogeochemical cycles and climate system?