Download
1 / 15
150 likes | 274 Vues
Developing hypotheses about the variability of climate variables using Erik den R øde data – the case of extra-tropical storminess.

E N D
Developing hypotheses about the variability of climate variables using Erik den Røde data – the case of extra-tropical storminess Fischer-Bruns, I., H. von Storch, E. Zorita and F. González-Rouco, 2004: A modelling study on the variability of global storm activity on time scales of decades and centuries. submitted
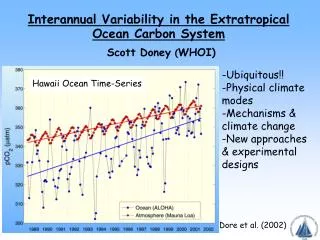
Empirical evidence about extratropical storm variability Estimates based upon pressure readings Lund and Stockholm Bärring and von Storch, 2004 Estimates based upon repair costs for dikes in Hollandde Kraker, 1999 Very little evidence available
ECHO-G simulations „Erik den Røde” (1000-1990) and “Christoph Columbus” (1550-1990) with estimated volcanic, GHG and solar forcing
Extratropical storminess • Determined by the frequency of maximum wind speeds in a grid cell of 8 Bft or more (17.2 m/s) • Number of storm days in DJF (top) and JJA (bottom) during preindustrial period 1550-1850
Extratropical storminess Pre-industrial: 1550-1850 change from pre-industrial to industrial period 1850-2000
.. .. .. .. • Mean number of storm days in winter per grid point averaged over the pre-industrial and industrially influenced periods of Erik and over the climate scenario A2 for each hemisphere. • Same index as function of time. • c) and d) same, but for North Atlantic region (90W-30E) and North Pacific region (150E-90W).
Extratropical Storm variations • North Atlantic • Mean near-surface temperature (red/orange) • storm frequency index (blue), • storm shift index (green) • 2 band of preindustrial conditions Storm shift index defined as PCs of storm frequency EOFs
Extratropical Storm variations • North Pacific • Mean near-surface temperature (red/orange) • storm frequency index (blue), • and storm shift index (green) • 2 band of preindustrial conditions Storm shift index defined as PCs of storm frequency EOFs
Extratropical Storm variations • Southern Hemisphere • Mean near-surface temperature (red/orange) • storm frequency index (blue), • and storm shift index (green) • 2 band of preindustrial conditions Storm shift index defined as PCs of storm frequency EOFs
Conclusions • During historical times storminess on both hemispheres is remarkably stationary with little variability. • During historical times, storminess and large-scale temperature variations are mostly decoupled. • In the climate change scenarios, with a strong increase of greenhouse concentrations, both temperature and storminess rise quickly beyond the 2σ-range of pre-industrial variations. • There are indications for a poleward shift of the regions with high storm frequency on both hemispheres with future warming. Altogether, we have ascertained an increase of the North Atlantic and SH storm frequency index, whereas the North Pacific storm frequency index decreases with beginning industrialization.
Conference on Utility of multicentury/millenium runs April, or so, 2006 in … Madrid Joint effort of U Madrid, GKSS and MPI, and?
Motivation • The question of historical reconstructions has been re-opened. • All statistical methods (based on regression) underestimate variability, in particular on longer time scales as no samples are available for training regression on these time scales. • Inflation may help to some extent, but its evidential basis is based on very few degrees of freedom. • Thus, efforts need to combine two sorts of knowledge, namely empirical (proxy, instrumental) and conceptual (GCMs).
Issues • Set-up of multi-century/millium integrations • Validation of MCMIs • Utility of MCMIs: Testing diagnostic methods (e.g., historical climate reconsructions; non-linear structures) • Utility of MCMIs: Testing proxy-data inversion methods by imbedding forward models of proxy formation in the climate model (e.g., borehole temps) • Utility of MCMIs: Derivation of hypotheses about variability of nonärecontructable climate variables (e.g., storminess)
We are in a planning stage • Can change as we like; • Further partners welcome; • But, don’t worry about organisational work – this will be (mostly) done by GKSS
Left column: Leading EOFs of storm frequency for the pre-industrial period of experiment H2 for the North Atlantic, North Pacific and SH region (top to bottom). Right column: Corresponding patterns of linear slope coefficient displayed at each grid point for the climate change experiment A2 determined by a linear trend analysis.