Download
1 / 21
210 likes | 288 Vues
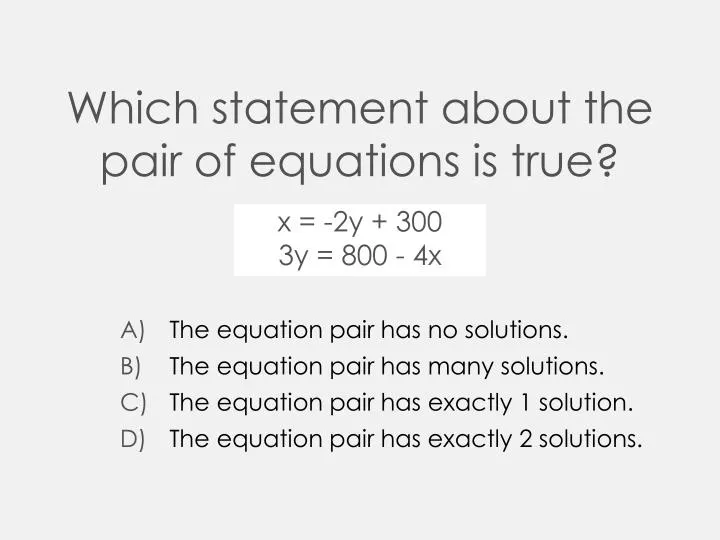
Which statement about the pair of equations is true ?. Page 2 7. D 8. C 9. B 10. D 11. A. Page 3 12. B 13. D 14. B 15. C 16. B. Page 4 17. B 18. A 19. A 20. B. Benchmark Answers. Page 1 A C B A C C. Take your score, divide by 2 and that will be your bonus!.

E N D
Page 2 7. D 8. C 9. B 10. D 11. A Page 3 12. B 13. D 14. B 15. C 16. B Page 4 17. B 18. A 19. A 20. B BenchmarkAnswers Page 1 A C B A C C Take your score, divide by 2 and that will be your bonus!
Unit 4 - Describing Data • Central Tendancies : Mean, Median, Mode • Spread: Q1, Q3, IQR, Min, Max, Range, MAD • Graphs: • Box-and-Whiskers • Histograms • Dot Plots • Correlation: positive, negative, none • Line of Best Fit • Probability Tables: Joint, Marginal, Conditional
1) Identify the 1st quartile, 3rd Quartile and the Median of the data. 1st: 68 3rd: 92 M: 84 2) What is the IQR of the data? 44 48 52 56 60 64 68 72 76 80 84 88 92 96 92 – 68 = 24
3) Find the Mean Absolute Deviation (MAD) of the following data: 77, 48, 65, 80, 70 Mean: 68 9+20+3+12+2 5 9.2
4) How many cars get between 15 and 30 miles per gallon? 4+4+2 = 10
5) What is the probability that a student surveyed is a freshman? 108/200 = .54 6) If a student likes Math, what is the probability that they are a sophomore? 22/72 = .31
7) Does the situation represent a positive, negative or no correlation • Number of hours studying for the SAT and your score • The distance you drive and the number of stars in the sky positive no correlation
8) Tell if the situation is causation • The number of boats on Lake Allatoona and the number of cars on the street • The hours you work and the money you make • The time spent studying and the A on the test no causation causation causation
9) Use the box plot to answer the following: Which class has the largest minimum heart rate? b) Which class has the smallest lower quartile? Class 3 Class 1
10) Which of the following graphs has a strong negative correlation? A B C D
11) The events x and y have a correlation coefficient of . What is the relationship between x and y? The events have a strong negative linear relationship. The events have a strong positive linear relationship The events have a weak negative linear relationship There is very little or no correlation.
12) Given the scatter plot, what is the best type of function to represent the data? Linear Quadratic Exponential No Correlation
13) Between which of the following variables would you expect there to be a positive correlation? The outside temperature and the number of layers of clothing a person wears. The number of students at Hillgrove and the number of cats at the animal shelter The number of cigarettes a person smokes and the person’s life expectancy The number of years spent in school and salary.
14) Which of the following is one of the 5 values needed to make a box-and whisker plot? Range 1st Quartile Mode Interquartile Range
15) Lauren asked five of her friends how long they practiced shooting free throws and their shooting percentage in the last 5 games. She found a linear regression equation for the data to be What does the 10.5 mean in the context of this equation? That her friends shot an average of 10.5 free throws a game. That for every hour they practiced, their free throw percentage went up 10.5 That they need to practice 10.5 hours a day to increase their free throw percentage. None of these
16) Ed and Dave each get paid a bonus at the end of each month. This table shows their bonuses: a) Who had the greater Median? Ed – 270 ** Dave – 280 b) Who had the smaller Range? ** Ed – 50 Dave – 90
17) a) Which shark lived longer than any other shark? Whale Shark b) About how long did the Basking Shark live? 32 years c) Which Shark lived about one-third as long as the Dusky Shark? Hound Shark
18) Tell what kind of Correlation the graph has. No Correlation Weak Negative Strong Positive
7. A 8. A 9. C 10. A 11. B Practice Answers C C B C B A