Download
1 / 32
320 likes | 423 Vues
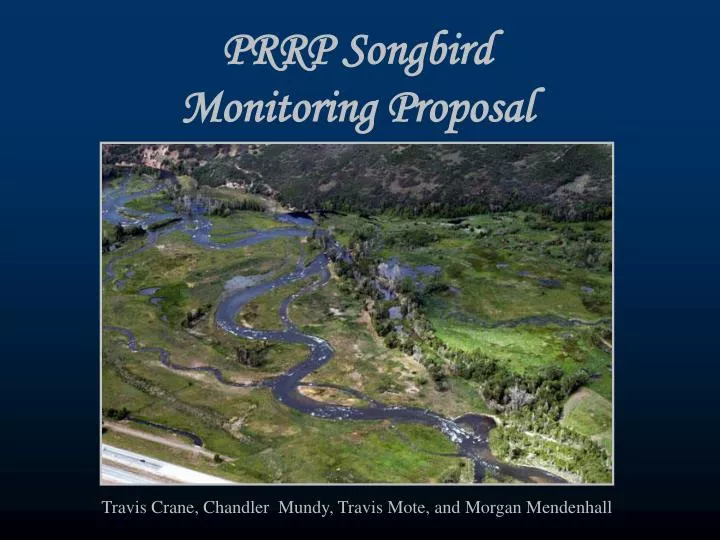
PRRP Songbird Monitoring Proposal. Travis Crane, Chandler Mundy, Travis Mote, and Morgan Mendenhall. Objective. Develop a monitoring plan to be used with habitat management in order to double the number of bird species on the ten-mile Provo River restoration project.

E N D
PRRP Songbird Monitoring Proposal Travis Crane, Chandler Mundy, Travis Mote, and Morgan Mendenhall
Objective Develop a monitoring plan to be used with habitat management in order to double the number of bird species on the ten-mile Provo River restoration project.
Provo River Restoration Project Dike removal River Meanders Water Speed Flooding Replanting Upper canopy veg. Low veg. Flooded areas
The Habitat Types • Flooded areas
The Habitat Types • Flooded areas • Low vegetation
The Habitat Types • Flooded areas • Low vegetation • Upper canopy
The Habitat Types • Flooded areas • Low vegetation • Upper canopy
Provo River Restoration Project Dike removal River Meanders Water Speed Flooding Replanting Upper canopy veg. Low veg. Flooded areas Nesting Habitat Nesting Habitat Nesting Habitat Cover Cover Cover Diet Diet Diet
Provo River Restoration Project Dike removal River Meanders Water Speed Flooding Replanting Upper canopy veg. Low veg. Flooded areas Nesting Habitat Nesting Habitat Nesting Habitat Cover Cover Cover Diet Diet Diet warbling vireo Wilson’s warbler yellow-headed black bird black-headed grosbeak Predators
Characteristics of the indicator species 1. Species must be relatively easy and inexpensive to monitor. 2. Indicators should be sensitive to the environment and will fluctuate in the same manner as their guild. 3. Species have direct relationship to target population. 4. Most importantly, indicators should meet management’s objectives of being adequate predictors of the target population.
Model of Indicator Species A Diet D B C Habitat
Warbling Vireo Vireo gilvus
Yellow-headed Blackbird Xanthocephalus xanthocephalus
METHODS Transect Surveys: yellow-headed blackbird Point Counts: warbling vireo, Wilson’s warbler, and black-headed grosbeak
Transect Surveys Transect Direction 100 meters
Analytical Methods Relative Abundance Presence/Absence Richness/Diversity
Statistical Software Computer programs will be heavily used to calculate and interpret data using statistical tools. • SAS • STATA
Chi-Square Test (2) 2=observed-expected expected
Paired T-test • Compare 2 or more years • Sampling units permanent • Measurement Data • Data grouped in transects or clusters
Paired T-test • Is there a statistically significant result? • What is the likelihood that no true change occurred and that any observed difference is the result of random sampling error? • Does the observed change have any biological significance?
Does the observed change have any biological significance? The power value uses the sample size, sample standard deviation, threshold significance level (α) and an effect size considered biologically important. The minimum detectable change is another calculation to judge biological significance. It uses the power value to calculate what minimum level of change could be detected.
Species diversity and richness Species richness is analyzed as a total number of species detected. Evenness, or the relative abundance of a species, is incorporated with species richness into a diversity index. Many indices exist; we will use the Shannon-Weaver index
Sampling Design Detect a minimum change of 20% with a 95% confidence level • Pilot Study • Ensure capture of population variation • Ensure narrow confidence interval • ● Low bias, no 0’s • ● Increased precision • Determine number of samples and plot size
The estimated sample sizes n=(st/E)2
Expected Products • Population estimates for indicator species • Species diversity for all three habitat types • Map of all study sites • Guidelines of monitoring methods • Management recommendations