Download
1 / 74
760 likes | 1.01k Vues
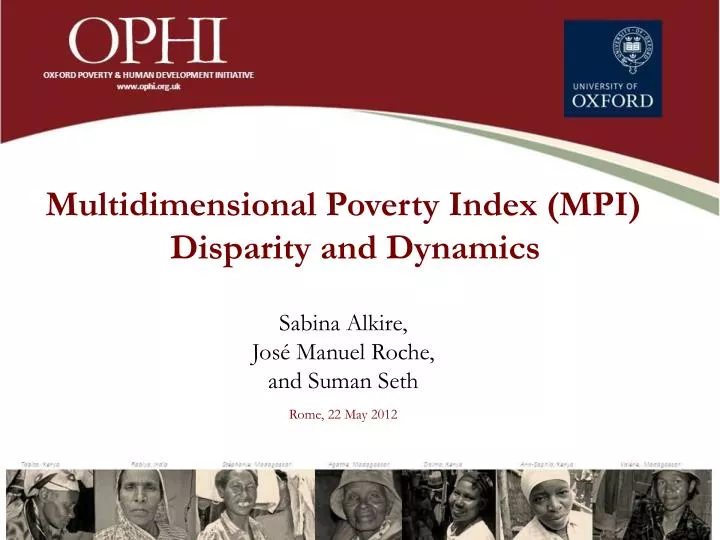
Multidimensional Poverty Index (MPI) Disparity and Dynamics Sabina Alkire, José Manuel Roche, and Suman Seth Rome, 22 May 2012. OPHI – MPI Team.

E N D
Multidimensional Poverty Index (MPI) Disparity and Dynamics Sabina Alkire, José Manuel Roche, and Suman Seth Rome, 22 May 2012
OPHI – MPI Team OPHI Research Team: Sabina Alkire (Director), James Foster (Research Fellow), John Hammock (Co-Founder and Research Associate), José Manuel Roche (coordination MPI 2011), Maria Emma Santos (coordination MPI 2010), Suman Seth, Paola Ballon, Gaston Yalonetzky, Diego Zavaleta. Data analysts and MPI calculation since 2011: Mauricio Apablaza, Adriana Conconi, Ivan Gonzalez DeAlba, Gisela Robles Aguilar, Juan Pablo Ocampo Sheen, Sebastian Silva Leander, Christian Oldiges, Nicole Rippin, and Ana Vaz. Special contributions:Mauricio Apablaza (analysis of family planning), Yadira Diaz (preparation of the maps), Maja Jakobsen (research assistance and preparation of graphs), Nicole Rippin (methodological inputs) Christian Oldiges (research assistance for regional decomposition), Gisela Robles Aguilar (tables, data compilation and preparation of the maps), John Hammock, Sabina Alkire and James Jewell (new Ground Reality Check field material), Maria Emma Santos (methodological inputs and adjustments of MPI methodology), Gaston Yalonetzky (design and programming for standard error calculation). Communication Team:Paddy Coulter (Director of Communications), Joanne Tomkinson (Research Communications Officer), Heidi Fletcher (Web Manager), Moizza B Sarwar (Research Communications Assistant), and Sarah Valenti (Research Communications Consultant) and Cameron Thibos (Design Assistant). Administrative Support: Tery van Taack (OPHI Project coordinator), Laura O'Mahony (OPHI Project Assistant) OPHI prepare the MPI for publication in the UNDP Human Development Report and we are grateful to our colleagues in HDRO for their support.
Multidimensional Poverty Index (MPI) - acute poverty in developing countries - What is new? MPI in Middle Income Countries Disparities MPI over Time Conclusions
What is the MPI? • The MPI 2011 isaninternationally comparable index of poverty for 109 developingcountries. • Itwaslaunched in 2010 in theHuman Development Report, and updated in 2011 • The MPI methodology can be adapted for nationalpovertymeasures – usingindicators and cutoffs for eachpolicycontext.
MPI METHODOLOGY
1. Data: SurveysDemographic & Health Surveys (DHS - 54) Multiple Indicator Cluster Surveys (MICS - 32)World Health Survey (WHS – 17)Additionally we used 6 special surveys covering urban Argentina (ENNyS), Brazil (PNDS), Mexico (ENSANUT), Morocco (ENNVM), Occupied Palestinian Territory (PAPFAM), and South Africa (NIDS)Constraints: Data are 2000-2010. Not all have precisely the same indicators.
Deprivation score of indicators, cutoffs, & weights built for each person
3. Identification: Who is poor? A person is multidimensionally poor if they are deprived in 33% of the dimensions. (censor the deprivations of the non-poor) 33%
How do you calculate the MPI? • The MPI uses the Alkire Foster method: • His the percentof people who are identified as poor, it shows the incidence of multidimensional poverty. • Ais the average proportion of weighted deprivations people suffer at the same time. It shows the intensity of people’s poverty – the joint distribution of their deprivations. The MPI isappropriate for ordinal data, and satisfiespropertieslikesubgroupconsistency, dimensional monotonicity, poverty & deprivationfocus. MPI islikethepoverty gap measure – but looks at breadthinstead – whatbatters a person at thesame time. Formula: MPI = M0 = H × A
What is new? Intensity. The MPI starts with each person, and constructs a deprivation profile for each person. Some people are identified as poor based on their joint deprivations. The others are identified as non-poor. • Most multidimensional poverty measures look at deprivations one by one, not at the household level. • Counting measures do look at coupled deprivations but only provide a headcount, giving no incentive to target those who are deprived in most things at the same time or to reduce intensity.
Phuba Deprived in 67% of dimensions. It doesn’t tell the full story But it gives some idea.
Global Results: These results are for 109 developing countries, selected because they have DHS, MICS or WHS data since 2000. Special surveys were used for Argentina, Brazil, Mexico, Morocco, Occupied Palestinian Territory, and South Africa They cover 5.3 billion people - 78.6% of the world’s population Of these 5.3 billion people, 31% of people are poor. That is 1.65 billion people. (2008 population figures taken from Population Prospects 2011; 2010 Revision).
Half of the world’s MPI poor people live in South Asia, and 29% in Sub-Saharan Africa Total Population in 109 MPI countries MPI poor people by region
The MPI Headcount Ratios and the $1.25/day Poverty 103 of our 109 Countries have income; only 71 have income poverty data within 3 years of MPI. Income data ranges from 1992-2008; MPI from 2000-2010.
Good coverage of Low and Middle Income Countries – over 90%. ~ 31 Low Income Countries,(700.9M), 92% ~ 70 Middle Income Countries, (1189.2M), 94%: ~ 42 Lower Middle Income (2378.9M) 97% ~ 28 Upper Middle Income (2178.9M) 90% ~ 8 High Income Countries (41.2M), of which: ~ 5 OECD (29.2M) ~ 2 non-OECD (12M) Total Population: 5.3 Billion people (population figures from 2008; data from 2000-2010).
Most poor people live in middle-income countries. More than twice as many poor people live in middle-income countries (1,189M) compared to low-income countries (459M). Total Population by Income Category (2008) MPI Poor Population (2008)
A person is ‘severely’ poor if he or she is deprived in half of the dimensions – not just 33%. There are more than twice as many ‘severely poor’ people in MICS as in LICS. And 50% of the world’s 869M severely poor also live in South Asia
Ethiopia’s Regional Disparities Ethiopia
Ethiopia’s Regional Disparities Afar Somali Dire Dawa Harari Addis Ababa
Nigeria’s Regional Disparities Nigeria
Nigeria’s Regional Disparities North East Nigeria South West
Ghana’s Regional Disparities Northern Ghana Greater Accra
Sub-national disparities in MPI(Highest disaggregation available)
A sub-regional MPI within South Asia is as large and as high as Sub-Saharan Africa’s 519mill. 473 mill. 0.366 26 poorest regions of South Asia
Child Mortality (CH) Nutrition (CH) School Attendance (CH) Safe Drinking Water (CH)
Different Poverty Profiles (Contributions) Data for 49 countries and 497 sub-national regions with 10 indicators were used
Let’s break intensity: Whose Deprivation Score exceeds 50? 70%? (Look at the poorest of the poor) India MPI = 0.283 A = 52.7% Lao 0.267 56.5% Kenya 0.229 48.0% Lao and India have more severe poor. Lao has the most deprived in over 70%