Download
1 / 17
170 likes | 179 Vues
Oneway ANOVA comparing 3 or more means. Overall Purpose. A Oneway ANOVA is used to compare three or more average scores. Used when there is one IV with 3 or more levels and one DV. Sample data are used to answer a question about population means. Examples.

E N D
Overall Purpose • A Oneway ANOVA is used to compare three or more average scores. • Used when there is one IV with 3 or more levels and one DV. • Sample data are used to answer a question about population means.
Examples • Does a new instructional method lead to more favorable student outcomes when compared to two types of traditional instruction comparison groups?
Examples • Do low-income preschool children who live in the following situations differ in school readiness? • father present in the home • see father regularly • no contact with their father
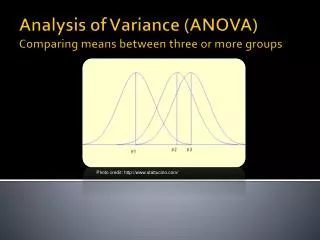
The F statistic • The F statistic is a ratio. • The denominator is within group variance. • The numerator is between group + within group variance. • t2=F for the two group case.
The F statistic • If the IV has no relationship to the population means, the F statistic will equal 1. • If F=1, there is no between group variance.
The F statistic • The F statistic examines whether sample means are varying more than they would be expected to vary due to sampling error alone.
Assumptions • Normality • Homogeneity of Variance • Independence of Observations • Random Sampling
Statistical Significance • How do you know when there is a statistically significant difference between the average scores you are comparing?
Statistical Significance • When the F statistic is greater than 1 by enough to be beyond sampling error. • We know this because the p value is less than alpha, usually set at .05.
Statistical Significance • A small p value tells us that there is a low probability that the variability in the means is due to sampling error alone. • We conclude there is more variability between the group means than would be expected by sampling error alone.
Hypotheses • Hypotheses for the Oneway ANOVA: Null Hypothesis: • m1 = m2 = m3 ... mk Alternative Hypothesis: • mi =/= mj for at least one pair. • At least two of the population means are different. Where: • k = the number of population means
Additional Considerations • There is a unique critical F value for each degrees of freedom condition. • A statistically significant F statistic does not tell us where the difference lies. • Confidence intervals and effect sizes can be very helpful in interpreting the results.
Example • Our research design:
The Research Question • Are classroom structural characteristic (class size, number of ELL children, etc.) different across the three stress groups?
Writing About Results • Use APA format for reporting test statistics and p values: • t(29) = 7.345, p=.005 • F(1,123) = 2.446, p = .122 • Recognize the distinction between a statistically significant finding and an important finding.
Writing About Results • Remember to review the writing guidelines in the handout on the website.