Download
1 / 11
110 likes | 242 Vues
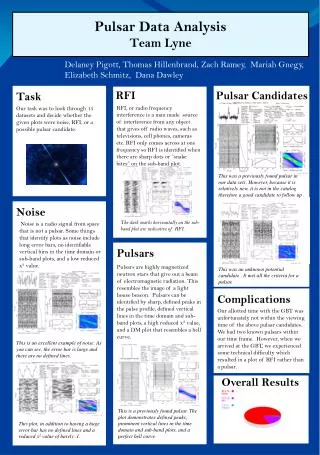
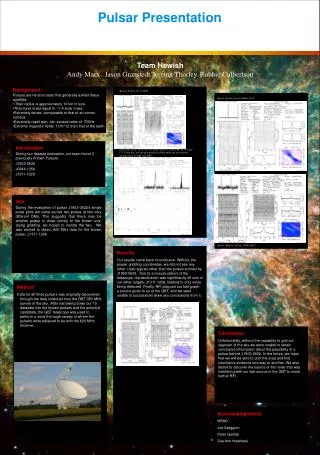
Team Bell Pulsar Analysis. David Dunkum, Shawn Hummer, Rekha Schnepf, Matt Thomas, Casey Thompson, Emily Underwood, and Diana Ventura. Our Data. 15 data sets from the 2007 GBT drift scan Plenty of RFI (14%) Mostly just noise (85%) A few known pulsars (1.333%) Three candidates

E N D
Team Bell Pulsar Analysis David Dunkum, Shawn Hummer, Rekha Schnepf, Matt Thomas, Casey Thompson, Emily Underwood, and Diana Ventura.
Our Data • 15 data sets from the 2007 GBT drift scan • Plenty of RFI (14%) • Mostly just noise (85%) • A few known pulsars (1.333%) • Three candidates (0.57%)
RFI • DM starts on zero on most if not all of the RFI. • They often have a strong signal like a pulsar, but usually are narrowband frequencies or have a strange pulse profile. • On some RFI, they have a specific period that is the same as electricity, 1198 ms.
Noise • Most noise will look like static on many of the graphs in each plot. • They are by far the most common thing that will be found in the collected data. • There will usually be no definite vertical lines in the sub-integration and the sub-band plots. • The DM and pulse profile will usually have little to no definite peaks. • The reduced X2 will usually be close to 0 or 1 when it is just noise, but not always.
Known Pulsars • There are very clear peaks in the pulse profile and in the DM. • Their DM also are within a reasonable range. • Some came in crystal clear while another one we found had some background noise. • They were also in the database when we checked after analyzing the plots, so that proved that they were already discovered pulsars.
Harmonics • We found several harmonics with some of the known pulsars we found. • Harmonics are from the same source as, say, a pulsar, but they occur at different frequencies that are an integer of the main source. • They occurred throughout the pointings that had their source pulsar.
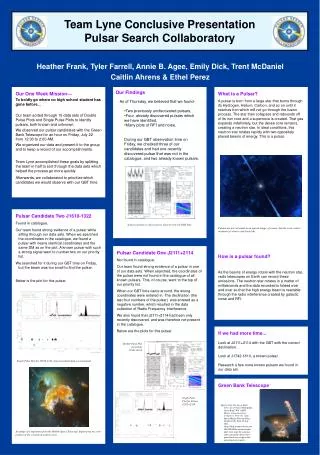
Candidates • We have found several single pulse candidates for follow-up research with the GBT. • They all have a clear peak in the top graphs and similar peaks in the bottom graphs, which makes them the best candidates we actually found in our data.
Unfortunate Circumstances • Due to unfortunate circumstances, the telescope moving on its own, overheated servos, hitting a thermal soft stop, and going over on our time, we were not able to collect our own data. Thankfully…
Joe and Pete decided to help us out • They scanned a known pulsar for us • It looked like this… • Even though the area scanned had a known pulsar within it, the technical difficulties continued with RFI in the beam, and there was nothing the astronomers (or we) could do.
Conclusion We have listed above the, • Data • RFI • Noise • Known Pulsars • Candidates • Harmonics • Results These are the things that we found and learned about during our week at the Green Bank Observatory.
Acknowledgements • Green Bank Observatory • NRAO • Sue Ann Heatherly • Sarah Scoles • Joe Swiggum • Pete Gentile • Dr. Duncan Lorimer • Dr. Maura McLaughlin • Casey Thompson • And everyone else who makes the PSC possible