Download
1 / 6
60 likes | 173 Vues
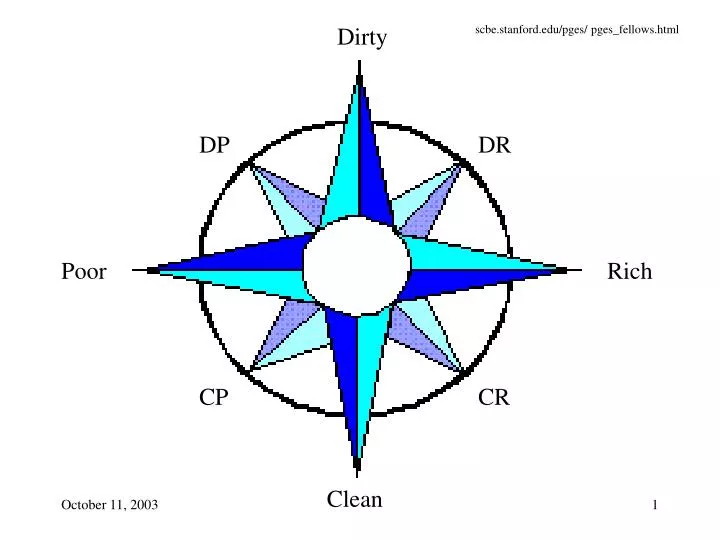
Dirty. scbe.stanford.edu/pges/ pges_fellows.html. DP. DR. Poor. Rich. CP. CR. Clean. 8 . 4 . 2 . 1 . 1/2 . 1/4 . 1/8 . 1/16 . SO2 Sust'y plane. 4 . 1.4. 2 . 0.7. 1 . 0.0. Per Initial Year. 0.0. 0.7. 1.4. 2.1. 1/2 . -0.7. 1/4 . -1.4. -2.1. 1/8 . 1 .

E N D
Dirty scbe.stanford.edu/pges/ pges_fellows.html DP DR Poor Rich CP CR Clean
8 4 2 1 1/2 1/4 1/8 1/16
SO2 Sust'y plane 4 1.4 2 0.7 1 0.0 Per Initial Year 0.0 0.7 1.4 2.1 1/2 -0.7 1/4 -1.4 -2.1 1/8 1 2 4 8 Income P C T PACT
4% 3% 2% 1% p 0% a %/yr 1900/1970 1900/1970 1970/2000 1970/2000 -1% c t -2% pact -3% -4% -5% -6%
4x 1.4 2x 0.7 1x 0.0 0.0 0.7 1.4 2.1 1/2x Per Initial Year -0.7 1/4x -1.4 1/8x -2.1 1/16x -2.8 1x 2x 4x 8x Income P C T PACT
c vs a at Income Lo (blue) and Hi (pink) 2% 1% 0% -4% -2% 0% 2% 4% 6% 8% 10% -1% -2% c -3% -4% -5% -6% -7% -8% a t vs a at Income Lo (blue) and Hi (pink) 4% 3% 2% 1% 0% t -4% -2% 0% 2% 4% 6% 8% 10% -1% -2% -3% -4% -5% -6% a