Download
1 / 47
470 likes | 607 Vues
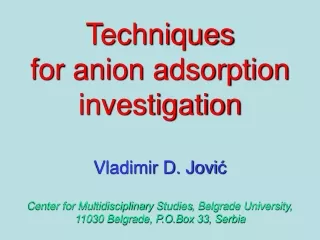
Techniques for anion adsorption investigation Vladimir D. Jovi ć Center for Multidisciplinar y Studies , Belgrade University, 11030 Belgrade, P.O.Box 33, Serbia. +. M. +. -. +. +. +. +. +. +. 2. +. -. +. +. S. Double layer structure and corresponding potential distribution.

E N D
Techniquesfor anion adsorption investigationVladimir D. JovićCenter for Multidisciplinary Studies, Belgrade University,11030 Belgrade, P.O.Box 33, Serbia
+ M + - + + + + + + 2 + - + + S Double layer structure and corresponding potential distribution
+ M + - + + S + + + - 2 + + + - + Double layer structure and corresponding potential distributionin the presence of specifically adsorbed anions
Differential capacity (EIS) measurementsfor determination of the properties of the double layer
Differential capacity measurementsDetermination of the potential of zero charge, Epzc(non-adsorbing electrolytes)[G. Quincke, Ann. Phys., 113 (1861) 513.] [G.Valette, A.Hamelin, J.Electroanal.Chem., 45(1973)301.]
Differential capacity measurementsNon-adsorbing electrolyte with addition of adsorbing Cl- ions [G.Valette, R.Parsons, J.Electroanal. Chem., 204 (1986) 291.]
In situ Scanning Tunneling Microscopy (STM) determination of ordered structures during anion adsorption
In situ STM image of ordered sulfate structures adsorbed onto Ag(111) [M.Schweizer, D.M.Kolb, Surf. Sci., 544 (2003) 93-102]
Structure model of the c(3x√3) sulfate structure adsorbed onto Ag(111) [M.Schweizer, D.M.Kolb, Surf. Sci., 544 (2003) 93-102]
In situ STM image of ordered sulfate structures adsorbed onto Ag(100) [M.Schweizer, D.M.Kolb, Surf. Sci., 544 (2003) 93-102]
Structure model of the (1.3 x 3.0) sulfate structure adsorbed onto Ag(100) [M.Schweizer, D.M.Kolb, Surf. Sci., 544 (2003) 93-102]
Bromide adlayer observed in the potential region III (0.15 V) and underlying Au(111)-(1x1) substrate (-0.05 V) observed in the potential region II.[A.Cuesta, D.M.Kolb, Surf. Sci., 465 (2000) 311-316]
Adsorption of sulfate anions onto Cu(111)Series of STM images showing the Moire formation process:duration of the series 12 min.
In situ STM image of Pd(111) surface obtained at 0.3 V, just before hydrogen adsorption (sharp peak).[Li-Jun Wan et al., J.Electroanal.Chem., 484 (2000) 189-193]
In situ STM image of ordered sulfate structure adsorbed onto Pd(111) [Li-Jun Wan et al., J.Electroanal.Chem., 484 (2000) 189-193]
In situ x-ray determination of ordered structures during anion adsorption(it requires high energy electrons obtained from the National Synchrotron Light Source at Brookhaven National Laboratory, New York, USA)
In situ x-ray technique (it can provide information about distribution of species parallel and normal to the surface)
EQMC and in situ stress measurements during anion and cation adsorption.UPD of Cu onto Au(111) and sulfate adsorption/desorption[O.E. Kongstein, U. Bertocci, G.R. Stafford, J. Electrochem. Soc., 152 (2005) C111-C123]
EQCM and in situ stress measurementsAu(111) textured substrate, 0.1M H2SO4 + 0.01M CuSO4
IMPORTANT REMARKS • There are some other “in situ” techniques used for determining the presence of anions in the double layer, such as FTIR and Raman spectroscopy and some “ex situ” techniques such as LEED etc.; • For the application of each of these techniques it is necessary to obtain CV first in order to define the system, for easier interpretation of ordered adsorbed structures; • None of the techniques is able to provide information about randomly distributed adsorbed structures except CV to some extent (qualitative interpretation – broad peaks).
New approach to the interpretation of the process of anion adsorption onto real single crystal surfaces
EQUATIONS FOR THE DOUBLE LAYER CAPACITY in the presence of adsorbing anions Determination of the double layer capacities is based on either, differential capacity measurements (Cdiff vs. E) performed at a single frequency, or on impedance measurements performed in a broad range of frequencies and the analysis of impedance diagrams using the adsorption impedance theory. According to this theory, the capacitance spectrum, C(), calculated from the measured impedance spectrum, Z(), can be expressed by the equation where Rs represents resistance of the solution, Cdl the double layer capacity, while Cad, Rad and adcorrespond to the capacity, resistance and Warburg coefficient of the adsorbate, respectively. From this equation it can be concluded that at high frequencies and low concentrations of adsorbate, the contribution of the second term becomes insignificant and the C() spectrum corresponds to the double layer capacity only. The Cdiff for such a case is given by the equation where cad and Dad represent the concentration and diffusion coefficient of the adsorbing anions, respectively. All the above mentioned consideration is valid for systems where the double layer capacity behaves as an ‘ideal double layer’, without ‘frequency dispersion’ in the range of low frequencies, i.e. assuming homogeneous electrode surfaces. If this is not the case, constant phase element (CPE) must be introduced (ZCPE = Y0(j),;Y0 [-1cm-2s]). For parallel connection of CPE and R can be expressed by two different equations
EQUIVALENT CIRCUITS FOR DOUBLE LAYER REPRESENTATION in the presence of adsorbing anions Cdl Rs CPE Rs (c) Zads Cad Rad CPE Zads (a) (d) Zads (b) Rs Rad Cad Zw Rad Cad Double layer capacity is represented by the parallel plate condenser (homogeneous charge distribution) Double layer capacity is represented by the Constant Phase Element (nonhomogeneous charge distribution)
Simulation of the differential capacity vs. frequency curves(homogeneous charge distribution – parallel plate condenser)
Simulation of the differential capacity vs. frequency curves(homogeneous charge distribution – parallel plate condenser)
Simulation of the differential capacity vs. frequency curves(non-homogeneous charge distribution – constant phase element)
Model and equivalent circuit for anion adsorption onto real single crystals Hence, considering all above mentioned it could be concluded that the equivalent circuit for anion adsorption onto real single crystal surfaces should be represented by two impedances, one corresponding to the process of anion adsorption onto heterogeneous part of the surface (monoatomic steps), Zadhe, and another one corresponding to the process of anion adsorption (formation of ordered structures) onto homogeneous part of the surface (flat terraces), Zadho. Such equivalent circuit is presented here with Radhe and CPEdlhe corresponding to the charge transfer resistance and constant phase element on the heterogeneous part of the surface respectively and Radho and Cad corresponding to the charge transfer resistance and capacity on the homogeneous part of the surface respectively.
Equations for the real and imaginary component of capacitance Commonly accepted procedure, particularly in the case of diffusion controlled anion adsorption, is based on the complex-plane CIm vs. CRe capacitance presentation and its analysis. Using the values for Cdl = 60 F, Cad = 200 F, Radho = 50 and Radhe = 5000 and varying the value of from 1.00 to 0.85 a complex-plane CIm vs. CRe capacity diagram presented in a following figure are obtained by simulation process.
Cyclic voltammetry and differential capacity measurementsof anion adsorption
Adsorption of chloride anions onto Ag(111) surface[V.D. Jović and B.M. Jović, J. Electroanal. Chem., 541 (2003) 1 – 11.]
Differential capacity vs. potential curves recorded for different frequencies
Differential capacity vs. frequency curves obtained from Cdiff vs. E curves
Adsorption of bromide anions onto Ag(100) surface[V.D. Jović and B.M. Jović, 57th ISE Meeting, Edinburgh, 2006.]
Impedance measurementsAg(100), 0.01M KBr E = -1.1 V E = -0.5 V E = -0.3 V
Differential capacity vs. frequency curves obtained from Cdiff vs. E curves E = - 1.2 V E = - 1.1 V • E = - 1.0 V • E = -0.8 V • E = - 0.75 V E = - 0.6 V E = - 0.1 V
CONCLUDING REMARKS From the presented results it is obvious that the most sensitive dependence for anion adsorption investigation is Cdiff vs. f() function; Considering charges under Cad vs. E curves for the system Ag(111)/0.01M NaCl (29 C cm-2) and Ag(100)/0.01M KBr (31 Ccm-2) and assuming that the electrosorption valence corresponds to the formation of ordered adsorbed structures, it appears that = - 0.4 and = - 0.3 respectively, i.e. both adsorbed anions are partially discharged. Hence, this analysis clearly indicates that neither the charge under the CV, nor that under Cdiff vs. E curve recorded at a single frequency, can be considered as relevant for determining either the structure of adsorbed anions or the value of ; Finally, it should be stated that the combination of cyclic voltammetry, in situ STM technique and Cdiff vs. E (f) curve analysis could be the best way for qualitative and quantitative interpretation of anion adsorption processes.