Download
1 / 79
800 likes | 1.19k Vues
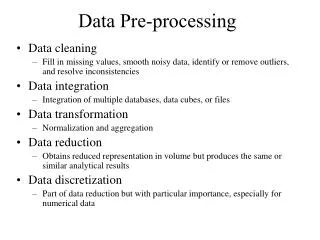
Microarray Pre-Processing. Mark Reimers CSHL Data 2012. Outline. Microarray technologies Quality assessment Background Normalization Other normalization issues Summarization of Affymetrix. Microarray Technologies. Outline. Library preparation Hybridization cDNA expression arrays

E N D
Microarray Pre-Processing Mark Reimers CSHL Data 2012
Outline • Microarray technologies • Quality assessment • Background • Normalization • Other normalization issues • Summarization of Affymetrix
Outline • Library preparation • Hybridization • cDNA expression arrays • Oligo expression arrays • Agilent • Affymetrix • Illumina • NimbleGen • Other array types
Hybridization • Microarrays measure the abundance of DNA or RNA by relative hybridization
Preparing a cDNA/RNA Library from mRNA • Reverse transcribe cDNA from RNA • Fragment • Amplify cDNA • OR • Use cDNA to transcribe RNA
Synthetic Oligonucleotide Arrays Up to 25 bases
Affymetrix Probes Schematic Actually Probes are (pseudo-) randomized
Affymetrix Probe Sets • Probes for older expression arrays are drawn from the 3’ end of the gene • Poly-T priming picks up poly-A tails of transcripts • Newer exon and whole-gene arrays have probes evenly distributed • Random priming more even – but not uniform!
Printed Oligonucleotide Arrays • Agilent (off-shoot of HP) uses printing technology
Agilent Arrays • Now second largest supplier of arrays • Reputation for high quality and attention to detail (e.g. scanner optics) • Typical 60 nucleotide probes (60-mers) • 44K, 185K, and 244K standard sizes • Can do several (up to 8) arrays per slide
NimbleGen Oligonucleotide Arrays Nimblegen uses a micro-mirror method to de-protect during oligo synthesis in situ
(Roche-) NimbleGen Arrays • Usually 60-mers • Random sequence controls provided • Standard sizes from 385K up to 2.1 million probes • Can also be multiplexed • Patent issues kept the production facility in Iceland
Illumina Bead Arrays • 3 mm beads manufactured with identifying segment (~12 nt) and 50-mer probe for target • Beads in wells (for some assays with optical fiber) • First scan reads ID tag; second reads target
Illumina Probes • Typically about 30 beads per array • SD very high • No controls on most arrays • Can be multiplexed
Quality Assessment • You are going to be doing a lot of intense analysis on expensive data • Are there any factors that would lead you to doubt or distrust a particular datum (array) ? • Quality of library – e.g. RNA quality • Quality of hybridization process • Statistical QA – try to detect non-random technical variation on any chip
RNA Quality Ideal: Two sharp peaks for 18S & 28S RNA Agilent BioAnalyzer
Statistical Approaches • Aim: are any samples different from others in technical preparation? • Exploratory Data Analysis (EDA) • Box plots, density plots, clustering, PCA • Are there any outliers? • These could be biologically interesting • Are there associations with technical factors? • Technician; date of sample prep; etc.
EDA - Boxplots • Boxplot of 16 chips from Cheung et al Nature 2005
Each Pair Replicates One Sample • Boxplot of 16 chips from Cheung et al Nature 2005
Some Causes of Technical Variation • Amount of RNA in sample differs always • Yield of conversion to cDNA or cRNA may differ • Label incorporation may differ • Temperature of hybridization may differ • RNA may be slightly degraded in some samples • Strength of ionic buffers differs • Stringency of wash differs • Scratches may occur on some chips • Ozone may bleach Cy5 at some times
Borrow an Idea from Model Testing • Question: Is the model adequate? Or do hidden factors cause systematic errors? • Examine residuals after fitting model • Should be IID Normal • Is there structure in residuals? • Plot against known technical covariates, such as order of sample • How to adapt residual examination for high-throughput assays?
Statistical QA for Arrays • Model for signal of probe i on chip j: yij ~ mi + eij • Each gene has same mean in all arrays (mostly true) • Look at residuals after fitting model • New twist for high-throughput assays: • Examine residuals within each chip (fix j; vary i) • Plot against known technical factors of probes • Is there any factor that seems to be predicting systematic errors?
Statistical QA of Arrays • Significant artifacts may not be obvious from visual inspection or bulk statistics • General approach: plot deviations from average or residuals from fit against any technical variable: • CG content or Tm (thermodynamics) • Probe position relative to 3’ end of gene (for poly-T primed RNA) • Physical location on chip (fluid artifacts) • Average Intensity across chips (saturation)
Saturation Decreasing rate of binding of RNA as more RNA occupies the probe Quenching: Light emitted by one dye molecule may be re-absorbed by a nearby dye molecule; then lost as heat Effect proportional to square of density Ratio vs Intensity Plots Reveal Saturation & Quenching Plot of log ratio against average log intensity across chips GSM25377 from the CEPH expression data GSE2552
How Much Variability on R-I? • Ratio-Intensity plots for six arrays at random from Cheung et al Nature (2005)
RNA Quality Plots in Bioconductor • affyRNAdeg plots in affy package • Effects do not appear large because averaged • Samples with RNA quaility differences stick out Plot of average intensity for each probe position across all genes against probe position
Local Bias on Affymetrix Chips Image of raw data on a log2 scale shows striations but no obvious artifacts Image of ratios of probes to standard shows a smudge Non-coding probes Images show high values as red, low values as yellow
Spatial Artifacts on Affy Chips Bubbles (yellow) in hybridization chamber Touching cover slip and wiping incompletely Scratches on cover slip
Model-Based QC for Affy in BioC • Robust Multi-chip Analysis (RMA) • fits a linear model to each probe set • High residuals show regional patterns High residuals in green See http://plmimagegallery.bmbolstad.com/ Available in affyQCReport package at www.bioconductor.org
Affy QC Metrics in Bioconductor • affyPLM package fits probe level model to Affymetrix raw data • NUSE - Normalized Unscaled Standard Errors • normalized relative to each gene • How many big errors?
Spatial Artifacts in Agilent • Usually artifacts are not as strong as on other array types • BUT – consequential because only one probe per gene • More diffuse artifacts are common • probably reflecting wash irregularities
Background Estimation Mark Reimers
General Issues in Estimating and Compensating Background • ‘Background’ is heterogeneous – different genomic regions or probes have very different background levels • Most are comparable and a few are high
Microarray Background • Non-specific hybridization • Cross-hybridization to specific non-targets • Distribution of Background has outliers • High CG more variable than low
Current Model for Background Estimation • 25-mers are prone to cross-hybridization • MM > PM for about 1/3 of all probes • Cross-hybridization varies with GC content • Bases at ends matter less than central • Signal intensity varies with cross-hybe • Simple approach is linear model: mj,k are mean effects of base j at position k
Estimate non-specific binding using either: True null assay (non-homologous RNA) Estimates from MM Rather than fit 25 independent coefficients fit spline with 5 df for each base Process background first; then normalize and fit model The gcRMAApproach to Background Correction Typical coefficients fit for each base at each position in the gcRMA background model (using 5df splines to model each base curve
Evaluating the gcRMA Model • We compared RNA-Seq data to microarray data on the same samples to identify genes that were not expressed; therefore all signal is cross-hybridization for these probes • We fit the gcRMA model to those probes • The model explained less than 10% of the variance among probes
Evaluating gcRMA • gcRMA won on AffyComp data sets (2006) using replicates with 14 spike-ins done by Affy • Many investigators get bad results (and don’t write it up) • Gharaibehet al.BMC Bioinformatics 2008 9:452 claimed that gcRMAdoes very well on highly expressed genes, not nearly so well on less expressed genes • That’s precisely where it doesn’t matter
Why Does gcRMA Fail? • gcRMA estimates cross-hybridization by fitting regression to MM probes • MM probes contain a good deal of specific signal • Symptom: gcRMA curves are almost identical for different chips, but cross-hybe varies considerably between chips assessed by other means (e.g. comparing controls or fitting the gcRMA model to genes known to be absent)
Does Cross-Hybridization Matter for Long Oligos? • Variation in GC content is more constrained • Cross-hybridization seems much more uniform • Too hard to estimate individual effects of bases • Model using quadratic curve to estimate distributions of bases over length is effective at reducing error • Three terms: constant, linear, quadratic
Common Normalization Methods • Simple parametric methods • Align mean or median intensities • Match mean/median and SD/MAD • Nonparametric methods • Lowess for two-color arrays • Align an‘Invariant Set’ across arrays • ‘Shoehorn’ all samples to a common distribution