Download
1 / 18
180 likes | 311 Vues
The Usual Source of Care and Delivery of Preventive Services to Medicare Beneficiaries. Hoangmai Pham, MD, MPH Deborah Schrag, MD, MPH* J. Lee Hargraves, PhD Peter B Bach, MD, MAPP** *Memorial Sloan Kettering Cancer Center ** Centers for Medicare and Medicaid Services.

E N D
The Usual Source of Care and Delivery of Preventive Services to Medicare Beneficiaries Hoangmai Pham, MD, MPH Deborah Schrag, MD, MPH* J. Lee Hargraves, PhD Peter B Bach, MD, MAPP** *Memorial Sloan Kettering Cancer Center ** Centers for Medicare and Medicaid Services Academy Health, June 2005
Does quality vary with physician characteristics? • Quality of care is suboptimal – across demographics, SES, conditions, communities • Evidence suggesting the influence of: • Physician sex, specialty, practice type for specific services or conditions • Definitively established associations can: • Direct quality assurance, quality improvement efforts • Affect patient or payer choice of physician
Study Objective • Assess associations between physician and practice characteristics, and the quality of preventive care their patients receive Physician characteristics Practice characteristics Preventive services
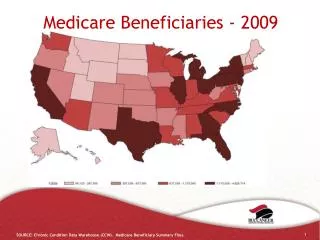
Methods – Data sources • 2000-01 Community Tracking Study Physician Survey • 12,406 respondents, 59% response rate • Clinically active physicians, PCPs oversampled • Nationally representative • Demographics, care setting, attitudes, practice behavior • Linked through performing UPINs, to • Medicare beneficiaries they treated in 2001, as captured by the 5% 2001 Carrier File
Methods – Populations • Physicians: • Assigning the usual source of care (USOC) physician • Physician billing for the plurality of a beneficiary’s evaluation and management visits • Ties broken by comparing total amount of paid claims • Limited to USOCs who were general internists or family/general pracitioners also responding to the CTS • Beneficiaries: • 65 years or older as of January 1, 2001 • Clinically eligible for at least one of six preventive services
Methods – Independent variables • Physician characteristics • Medical school site, Specialty, Board certification, Number of years in practice, Sex • Practice setting characteristics • Practice type, Urban vs. rural location • % revenue from Medicare, Medicaid, managed care • HIT to access treatment guidelines or to generate reminders
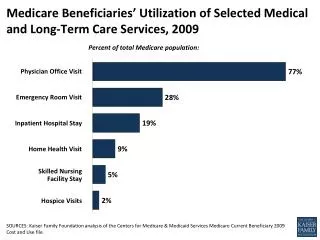
Methods – Outcome variables • Whether clinically eligible beneficiaries received each preventive services once • Diabetic care – Eye exams and Hemoglobin A1c testing • Cancer screening – Mammography and Colonoscopy/sigmoidoscopy • Vaccinations – Influenza and Pneumococcal
Methods – Analysis • Unit of analysis: Individual beneficiary • Logistic regression, applied CTS survey weights • Adjusted for • All other independent variables • Beneficiary age, sex, race, comorbidity score (Klabunde) • Median income in beneficiary’s zip code • % of county adult population with 12+ yrs education • % of beneficiary’s visits with USOC physician • Number of clinical radiologists per capita in MSA
Results – Physicians and Beneficiaries Physicians Beneficiaries • 5,914 diabetics eligible for eye exams and HbA1c • 6,928 women for mammograms • 17,525 eligible for colon cancer screening • 24,581 eligible for vaccinations
Results – Physician characteristics and Proportion of beneficiaries receiving preventive services *p<0.05, **p<0.01, ***p<0.001
Results – Practice characteristics and Proportion of beneficiaries receiving services *p<0.05, **p<0.01, ***p<0.001
Results – Physician characteristics and delivery of services, adjusted OR’s (95% CI)
Results – Practice characteristics and delivery of services, adjusted OR’s (95% CI)
Summary • Quality of preventive care is suboptimal across the board • Physician and practice characteristics associated with delivery of preventive services • Strongest associations were with practice level factors – revenue from Medicaid and practice type, less so availability of HIT • Medical school site, specialty, and board certification
Conclusions and Implications • Physician and practice factors account for a meaningful degree of the variation in quality of preventive care • Practice level factors appear particularly influential and should be considered, in addition to individual physician factors, in designing quality improvement interventions
Results – Physician characteristics and Proportion of beneficiaries receiving preventive services *p<0.05, **p<0.01, ***p<0.001