Download
1 / 9
90 likes | 190 Vues
Automotive Growth and Infrastructure Boom in Asia and South America Driving the Growth of Demand for Carbon Black to Reach 20 million MTs by 2022<br><br>ndustry Experts has today released the new market research report on carbon black. The new report ‘Carbon Black – A Global Market Overview’ reveals that Asia-Pacific is estimated to be the largest market with 7.9 million metric tons and US$8.1 billion in 2016 respectively for volume consumption and market value. The region is also expected to be the fastest growing market with CAGRs for volume and value respectively 6.3% and 6.8% during 2016-2022 while South America closely follows with CAGRs of 5.3% and 5.5% for the same period.<br><br>Worldwide market for Carbon Black application segments explored in this study includes Industrial Rubber Products, Paints & Coatings, Plastics, Printing Inks & Toners and Tires. The global markets for the above mentioned application segments are analyzed in terms of value in metric tons and value in USD. Global consumption of Carbon Black, estimated at 13.2 million metric tons valued at US$13.7 billion in 2015, is expected to reach 13.9 million metric tons equated to US$14.4 billion in 2016 and further forecast to maintain a CAGR of 5.6% between 2016 and 2022 to reach 19.2 million metric tons equalent of US$20.4 billion by 2022.<br>This 328 page global market research report includes 240 charts (includes a data table and graphical representation for each chart), supported with meaningful and easy to understand graphical presentation, of market numbers. This report profiles 21 key global players and 29 major players across North America – 5; Europe – 5; and Asia-Pacific – 19. The research also provides the listing of the companies engaged in manufacturing and supply of Carbon Black. The global list of companies covers addresses, contact numbers and the website addresses of 180 companies.<br><br>Hyderabad, India based Industry Experts is a multi industry focused business information provider.<br><br>For more details, please visit http://industry-experts.com/verticals/chemicals-and-materials/carbon-black-a-global-market-overview

E N D
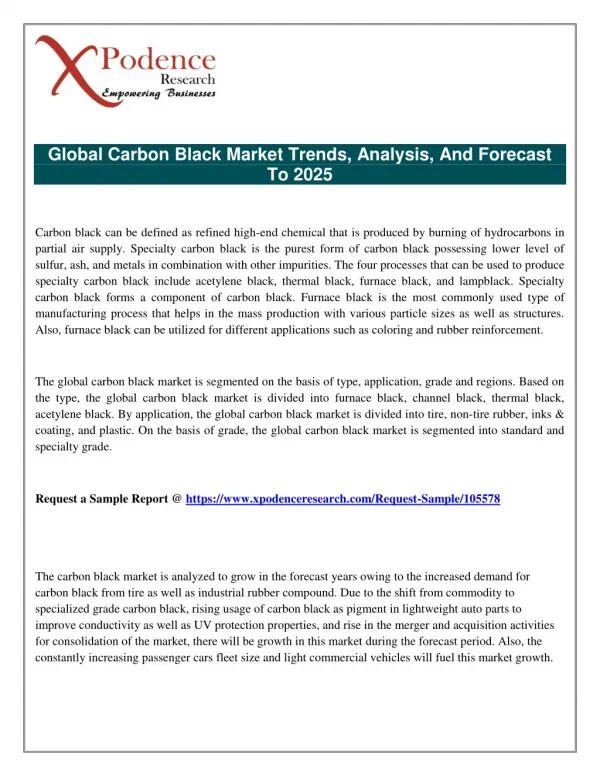
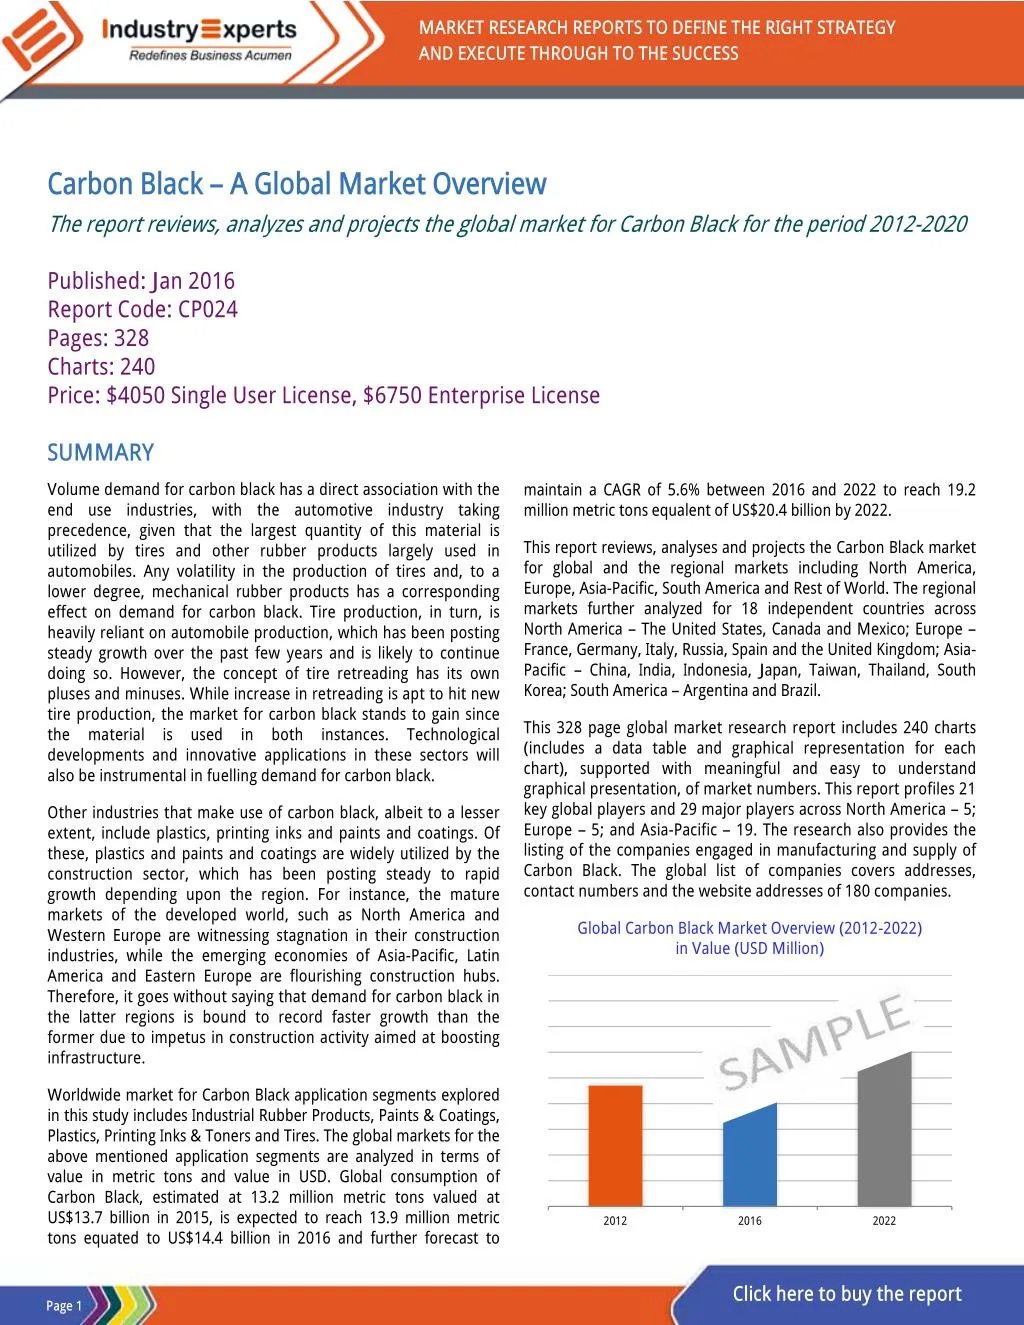
MARKET RESEARCH REPORTS TO DEFINE THE RIGHT STRATEGY AND EXECUTE THROUGH TO THE SUCCESS Carbon Black – A Global Market Overview The report reviews, analyzes and projects the global market for Carbon Black for the period 2012-2020 Published: Jan 2016 Report Code: CP024 Pages: 328 Charts: 240 Price: $4050 Single User License, $6750 Enterprise License SUMMARY Volume demand for carbon black has a direct association with the end use industries, with the automotive industry taking precedence, given that the largest quantity of this material is utilized by tires and other rubber products largely used in automobiles. Any volatility in the production of tires and, to a lower degree, mechanical rubber products has a corresponding effect on demand for carbon black. Tire production, in turn, is heavily reliant on automobile production, which has been posting steady growth over the past few years and is likely to continue doing so. However, the concept of tire retreading has its own pluses and minuses. While increase in retreading is apt to hit new tire production, the market for carbon black stands to gain since the material is used in both instances. Technological developments and innovative applications in these sectors will also be instrumental in fuelling demand for carbon black. maintain a CAGR of 5.6% between 2016 and 2022 to reach 19.2 million metric tons equalent of US$20.4 billion by 2022. This report reviews, analyses and projects the Carbon Black market for global and the regional markets including North America, Europe, Asia-Pacific, South America and Rest of World. The regional markets further analyzed for 18 independent countries across North America – The United States, Canada and Mexico; Europe – France, Germany, Italy, Russia, Spain and the United Kingdom; Asia- Pacific – China, India, Indonesia, Japan, Taiwan, Thailand, South Korea; South America – Argentina and Brazil. This 328 page global market research report includes 240 charts (includes a data table and graphical representation for each chart), supported with meaningful and easy to understand graphical presentation, of market numbers. This report profiles 21 key global players and 29 major players across North America – 5; Europe – 5; and Asia-Pacific – 19. The research also provides the listing of the companies engaged in manufacturing and supply of Carbon Black. The global list of companies covers addresses, contact numbers and the website addresses of 180 companies. Other industries that make use of carbon black, albeit to a lesser extent, include plastics, printing inks and paints and coatings. Of these, plastics and paints and coatings are widely utilized by the construction sector, which has been posting steady to rapid growth depending upon the region. For instance, the mature markets of the developed world, such as North America and Western Europe are witnessing stagnation in their construction industries, while the emerging economies of Asia-Pacific, Latin America and Eastern Europe are flourishing construction hubs. Therefore, it goes without saying that demand for carbon black in the latter regions is bound to record faster growth than the former due to impetus in construction activity aimed at boosting infrastructure. Global Carbon Black Market Overview (2012-2022) in Value (USD Million) Worldwide market for Carbon Black application segments explored in this study includes Industrial Rubber Products, Paints & Coatings, Plastics, Printing Inks & Toners and Tires. The global markets for the above mentioned application segments are analyzed in terms of value in metric tons and value in USD. Global consumption of Carbon Black, estimated at 13.2 million metric tons valued at US$13.7 billion in 2015, is expected to reach 13.9 million metric tons equated to US$14.4 billion in 2016 and further forecast to 2012 2016 2022 Click here to buy the report Page 1
Carbon Black – A Global Market Overview Jan 2016 |328 Pages | 240 Charts | Price $4050 SAMPLE COMPANY PROFILE SAMPLE TABLE/CHART Glance at 2017 Global Carbon Black Volume Market Share (%)Application – Industrial Rubber Products, Paints & Coatings, Plastics, Printing Inks & Toners and Tires MITSUBISHI CHEMICAL CORPORATION (JAPAN) 1-1 Marunouchi 1-chome, Chiyoda-ku, Tokyo 100-8251, Japan Phone: [+81] (0)3-6748-7300 Fax: [+81] (0)3-3286-1210 Website: www.m-kagaku.co.jp Business Overview Established by a merger between Mitsubishi Kasei Corp and Mitsubishi Petrochemical Co in 1994, Mitsubishi Chemical Corporation, along with its subsidiaries, is engaged in manufacturing petrochemicals, pharmaceuticals, functional materials and plastic-based products, specialty chemicals, carbon, and chemicals and products used in the electronics industry. The company’s range of offerings comprises display and related materials, materials for lithium-ion battery, photovoltaic materials, imaging materials, electronic chemicals, specialty chemicals, separating medium, carbon materials and products, performance polymers and raw materials, commodity polymers and raw materials, materials for synthetic fibers, solvents, surfactants, acrylic acid, acrylic acid derivatives, C4 chemicals and basic petrochemicals. and distributing Global Carbon Black Application in Industrial Rubber Products Volume Market Analysis (2012-2022) by Geographic Region – North America, Europe, Asia- Pacific, South America and Rest of World in '000 Metric Tons 2012 2016 2022 KEY PLAYERS PROFILED •Asahi Carbon Co Ltd •Birla Carbon •Black Bear Carbon BV •Cabot Corporation •Carbon Clean Tech AG •China Synthetic Rubber Corporation •Continental Carbon Company •Jinneng Science and Technology Company Limited •Longxing Chemical Stock Co Ltd •Mitsubishi Chemical Corporation •Monolith Materials Inc •Nippon Steel & Sumikin Chemical Co Ltd •OCI Company Ltd •Omsk Carbon Group OOO •Orion Engineered Carbons SA •Phillips Carbon Black Limited •Qingzhou Boao Carbon Black Co Ltd •Shandong Huadong Rubber Materials Co Ltd •Shandong Lion King Carbon Black Co Ltd •Sid Richardson Carbon and Energy Co Ltd •Tokai Carbon Co Ltd Carbon Black Product Portfolio Product Particulars MITSUBISHI™ Carbon Black A black pigment that finds application in areas, such as newspaper ink, printing ink, colored resin, paint, toner, colored paper, India ink, and ceramic. Available in various grades ranging from all- purpose grade to high-grade DIABLACK™ Rubber Carbon Black Finds reinforcement material in a variety of products, such as tires and rubber products application as rubber DIAPOL™-WMB SBR-Carbon Black Masterbatch A composite material (wet masterbatch) produced by acid coagulation of SBR latex, carbon black and water slurry in an ultra-dispersion application as a raw material for industrial products, water seals and gaskets and tires and belts process. Finds …………………….more …………………….more Click here to buy the report Page 2
Carbon Black – A Global Market Overview Jan 2016 |328 Pages | 240 Charts | Price $4050 TABLE OF CONTENTS Chart 7: Global Carbon Black Volume Market Analysis (2012-2022) by Application – Industrial Rubber Products, Paints & Coatings, Plastics, Printing Inks & Toners and Tires in ‘000 Metric Tons ................................................ 59 Chart 8: Glance at 2012, 2017 and 2022 Global Carbon Black Volume Market Share (%)Application – Industrial Rubber Products, Paints & Coatings, Plastics, Printing Inks & Toners and Tires.......................................................... 60 6.1.1 Carbon Black Application Volume Market Overview by Global Region ...................................... 61 6.1.1.1 Industrial Rubber Products .......................... 61 Chart 9: Global Carbon Black Application in Industrial Rubber Products Volume Market Analysis (2012-2022) by Geographic Region – North America, Europe, Asia-Pacific, South America and Rest of World in '000 Metric Tons ... 61 Chart 10: Glance at 2012, 2017 and 2022 Global Carbon Black Application in Industrial Rubber Products Volume Market Share (%) by Geographic Region – North America, Europe, Asia-Pacific, South America and Rest of World .. 62 6.1.1.2 Paints & Coatings ......................................... 63 Chart 11: Global Carbon Black Application in Paints & Coatings Volume Market Analysis (2012-2022) by Geographic Region – North America, Europe, Asia-Pacific, South America and Rest of World in '000 Metric Tons ... 63 Chart 12: Glance at 2012, 2017 and 2022 Global Carbon Black Application in Paints & Coatings Volume Market Share (%) by Geographic Region – North America, Europe, Asia-Pacific, South America and Rest of World ............... 64 6.1.1.3 Plastics ......................................................... 65 Chart 13: Global Carbon Black Application in Plastics Volume Market Analysis (2012-2022) by Geographic Region – North America, Europe, Asia-Pacific, South America and Rest of World in '000 Metric Tons .............. 65 Chart 14: Glance at 2012, 2017 and 2022 Global Carbon Black Application in Plastics Volume Market Share (%) by Geographic Region – North America, Europe, Asia-Pacific, South America and Rest of World ................................... 66 6.1.1.4 Printing Inks & Toners .................................. 67 Chart 15: Global Carbon Black Application Printing Inks & Toners Volume Market Analysis (2012-2022) in by Geographic Region – North America, Europe, Asia-Pacific, South America and Rest of World in '000 Metric Tons ... 67 Chart 16: Glance at 2012, 2017 and 2022 Global Carbon Black Application in Printing Inks & Toners Volume Market Share (%) by Geographic Region – North America, Europe, Asia-Pacific, South America and Rest of World ............... 68 6.1.1.5 Tires ............................................................. 69 Chart 17: Global Carbon Black Application in Tires Volume Market Analysis (2012-2022) by Geographic Region – North America, Europe, Asia-Pacific, South America and Rest of World in '000 Metric Tons .................................. 69 Chart 18: Glance at 2012, 2017 and 2022 Global Carbon Black Application in Tires Volume Market Share (%) by Geographic Region – North America, Europe, Asia-Pacific, South America and Rest of World ................................... 70 6.2 Global Carbon Black Value Market Overview by Application .............................................................. 71 Chart 19: Global Carbon Black Value Market Analysis (2012-2022) by Application – Industrial Rubber Products, Paints & Coatings, Plastics, Printing Inks & Toners and Tires in USD Million ........................................................ 71 Chart 20: Glance at 2012, 2017 and 2022 Global Carbon Black Value Market Share (%)Application – Industrial Rubber Products, Paints & Coatings, Plastics, Printing Inks & Toners and Tires.......................................................... 72 6.2.1 Carbon Black Application Value Market Overview by Global Region ...................................... 73 6.2.1.1 Industrial Rubber Products .......................... 73 Chart 21: Global Carbon Black Application in Industrial Rubber Products Value Market Analysis (2012-2022) by Geographic Region – North America, Europe, Asia-Pacific, South America and Rest of World in USD Million ........... 73 2.4.1.4 Energy Cure Printing Inks ............................. 22 2.5 Tires ................................................................... 23 Chart 5: Trending of Global Carbon Black Application in Tires by Geographic Region (2015 & 2020) in ‘000 Metric Tons .............................................................. 23 Table 6: Ranges of Properties for Carbon Blacks Frequently used in Tires .................................................................... 24 3. KEY MARKET TRENDS ........................................ 26 3.1 The Era of “Green” Carbon Blacks Dawning ....... 26 3.2 Major Trends in the Carbon Black Market for Rubber ..................................................................... 28 3.3 Growth in Tire Production Translates into Carbon Black Deficit in the US .............................................. 29 4. KEY GLOBAL PLAYERS ........................................ 31 Asahi Carbon Co Ltd (Japan) ............................................ 31 Birla Carbon (India) ......................................................... 32 Black Bear Carbon BV (The Netherlands) ........................ 33 Cabot Corporation (United States) .................................. 34 Carbon Clean Tech AG (Germany) ................................... 35 China Synthetic Rubber Corporation (Taiwan) ................ 35 Continental Carbon Company (United States) ................ 36 Jinneng Science and Technology Company Limited (China) ... 36 Longxing Chemical Stock Co Ltd (China) .......................... 37 Mitsubishi Chemical Corporation (Japan)........................ 38 Monolith Materials Inc (United States) ........................... 39 Nippon Steel & Sumikin Chemical Co Ltd (Japan) ............ 39 OCI Company Ltd (South Korea) ...................................... 40 Omsk Carbon Group OOO (Russia) .................................. 41 Orion Engineered Carbons SA (Luxembourg) .................. 43 Phillips Carbon Black Limited (India) ............................... 44 Qingzhou Boao Carbon Black Co Ltd (China) ................... 46 Shandong Huadong Rubber Materials Co Ltd (China) ..... 47 Shandong Lion King Carbon Black Co Ltd (China) ............ 48 Sid Richardson Carbon and Energy Co Ltd (United States) ..... 49 Tokai Carbon Co Ltd (Japan) ............................................ 51 5. KEY BUSINESS TRENDS ...................................... 52 Cabot Corp Shuts Down Carbon Black Plant in Merak, Indonesia ........................................................................ 52 Carbon clean tech Bags Order from a Global Tire Producer ... 52 Carbon clean tech Inaugurates R&D Center .................... 52 Orion Engineered Carbons Takes Over Evonik and DEG Stakes in Chinese Carbon Black Joint Venture ................. 52 Cabot Corp Increases Prices of Carbon Black Used in Tire and Industrial Rubber Products Applications .................. 53 Cabot Introduces New Family of Carbon Black Products . 53 Sid Richardson Focuses on Mexico for New Facility ........ 54 Pyrolyx AG and carbon clean tech AG Merge .................. 54 Brenntag AG and carbon clean tech AG Enter into a Distribution Agreement .................................................. 54 Monolith Materials’ New Carbon Black Plant Coming Up in Nebraska ......................................................................... 54 Birla Carbon Intends Setting Up a Greenfield Carbon Black Manufacturing Unit in China’s Shandong Province ......... 55 OCI to Build Coal Tar Refinery Plant in China’s Anhui Province ......................................................................... 55 Cabot’s New Fumed Silica and Carbon Black Products Introduced ...................................................................... 55 Tokai Carbon to Take Over Cancarb ................................ 55 Mitsubishi Chemical Sets Up Mass-Production Technology for Plant Oil-Based Carbon Black ..................................... 56 Orion Closes Portugal Carbon Black Facility .................... 56 Cabot Corp Acquires NHUMO ......................................... 56 Aditya Birla Nuvo’s Carbon Black Operations Divested ... 56 Cancarb and Nordmann, Rassmann GmbH Extend Distribution Alliance ........................................................ 57 Aditya Birla Group Acquires Columbian Chemicals ......... 57 OCI Expands Carbon Black Manufacturing Capacity ........ 57 6. GLOBAL MARKET OVERVIEW ............................. 58 Chart 6: Global Carbon Black Market Overview (2012-2022) in Volume (‘000 Metric Tons) and Value (USD Million) ...... 58 6.1 Global Carbon Black Volume Market Overview by Application............................................................... 59 PART A: GLOBAL MARKET PERSPECTIVE ........ 1 1. INTRODUCTION .................................................. 1 1.1 Product Outline .................................................... 2 1.1.1 Backdrop ........................................................... 2 1.1.2 Fundamentals of Carbon Black ......................... 2 1.1.3 Production of Carbon Black .............................. 2 1.1.3.1 Furnace Black Process .................................... 2 1.1.3.2 Thermal Black Process ................................... 3 1.1.3.3 Other Processes ............................................. 3 1.1.3.3.1 Channel Black Process ................................. 3 1.1.3.3.2 Lamp Black Process ..................................... 4 1.1.4 Carbon Black, Soot and Black Carbon ............... 4 1.1.5 General Properties of Carbon Black .................. 4 Table 1: Chemical Names and Chemical Identification of Carbon Black ..................................................................... 4 Table 2: Properties and Characteristic of Carbon Black as Obtained From Furnace Process ........................................ 5 1.1.6 Essential Properties of Carbon Black ................. 5 1.1.6.1 Aggregates ..................................................... 5 1.1.6.2 Inter-Particle Attractions and Agglomerates .. 5 1.1.7 Color Properties of Carbon Black ...................... 6 1.1.7.1 Jetness ........................................................... 6 1.1.7.2 Masstone ....................................................... 6 1.1.7.3 Tinting Strength ............................................. 7 1.1.8 Techniques of Characterizing Carbon Black ...... 7 1.1.8.1 Measurements of Surface Area ..................... 7 1.1.8.2 Measurements of Structure ........................... 8 1.1.9 Particle Range of Rubber-Grade Carbon Blacks 9 1.1.10 Summary Information on Particle Size ............ 9 1.1.11 Grades, Production Processes, Selected Properties and Uses of Carbon Black ....................... 10 1.1.12 Typical Properties of Rubber-Grade Carbon Blacks ....................................................................... 10 1.1.13 Typical Properties of Furnace Blacks Used in Inks, Paints and Plastics ........................................... 12 2. APPLICATION ANALYSIS .................................... 13 2.1 Industrial Rubber Products ................................ 13 Chart 1: Trending of Global Carbon Black Application in Industrial Rubber Products by Geographic Region (2015 & 2020) in ‘000 Metric Tons .......................... 13 Table 3: Some Commonly Used Grades of Carbon Black in Rubber Industry with their Properties and Applications .. 14 2.2 Paints & Coatings ............................................... 15 Chart 2: Trending of Global Carbon Black Application in Paints & Coatings by Geographic Region (2015 & 2020) in ‘000 Metric Tons ........................................ 15 2.2.1 Carbon Black Grade Selection for Coloring ..... 16 2.2.1.1 Black Coatings .............................................. 16 Table 4: Preferred Forms of Carbon Black that Offer Best Results with Each of Major Pieces of Equipment ............. 16 Table 5: Some of the More Commonly used Oil Furnace Carbon Black Grades that are used in Paints & Coatings Sector .............................................................................. 17 2.2.1.2 Black Tinted Coatings ................................... 17 2.3 Plastics ............................................................... 18 Chart 3: Trending of Global Carbon Black Application in Plastics by Geographic Region (2015 & 2020) in ‘000 Metric Tons ...................................................... 18 2.4 Printing Inks & Toners ........................................ 20 Chart 4: Trending of Global Carbon Black Application in Printing Inks & Toners by Geographic Region (2015 & 2020) in ‘000 Metric Tons .................................... 20 2.4.1 Pigment Blacks Based on Application ............. 21 2.4.1.1 Offset Inks .................................................... 21 2.4.1.2 Publication Applications .............................. 22 2.4.1.3 Flexographic and Gravure Printing Inks for Packaging Applications ............................................ 22 Click here to buy the report Page 3
Carbon Black – A Global Market Overview Jan 2016 |328 Pages | 240 Charts | Price $4050 Chart 22: Glance at 2012, 2017 and 2022 Global Carbon Black Application in Industrial Rubber Products Value Market Share (%) by Geographic Region – North America, Europe, Asia-Pacific, South America and Rest of World ... 74 6.2.1.2 Paints & Coatings ......................................... 75 Chart 23: Global Carbon Black Application in Paints & Coatings Value Market Analysis (2012-2022) by Geographic Region – North America, Europe, Asia-Pacific, South America and Rest of World in USD Million ............ 75 Chart 24: Glance at 2012, 2017 and 2022 Global Carbon Black Application in Paints & Coatings Value Market Share (%) by Geographic Region – North America, Europe, Asia- Pacific, South America and Rest of World........................ 76 6.2.1.3 Plastics ......................................................... 77 Chart 25: Global Carbon Black Application in Plastics Value Market Analysis (2012-2022) by Geographic Region – North America, Europe, Asia-Pacific, South America and Rest of World in USD Million ........................................... 77 Chart 26: Glance at 2012, 2017 and 2022 Global Carbon Black Application in Plastics Value Market Share (%) by Geographic Region – North America, Europe, Asia-Pacific, South America and Rest of World ................................... 78 6.2.1.4 Printing Inks & Toners .................................. 79 Chart 27: Global Carbon Black Application Printing Inks & Toners Value Market Analysis (2012-2022) in by Geographic Region – North America, Europe, Asia-Pacific, South America and Rest of World in USD Million ............ 79 Chart 28: Glance at 2012, 2017 and 2022 Global Carbon Black Application in Printing Inks & Toners Value Market Share (%) by Geographic Region – North America, Europe, Asia-Pacific, South America and Rest of World ................ 80 6.2.1.5 Tires ............................................................. 81 Chart 29: Global Carbon Black Application in Tires Value Market Analysis (2012-2022) by Geographic Region – North America, Europe, Asia-Pacific, South America and Rest of World in USD Million ........................................... 81 Chart 30: Glance at 2012, 2017 and 2022 Global Carbon Black Application in Tires Value Market Share (%) by Geographic Region – North America, Europe, Asia-Pacific, South America and Rest of World ................................... 82 PART B: REGIONAL MARKET PERSPECTIVE ... 83 Chart 31: The Largest Independent Regions in Terms of Projected Growth (2016-2022) for Carbon Black Market by Geographic Region – North America, Europe, Asia-Pacific, South America and Rest of World ................................... 83 Global Carbon Black Market Overview by Geographic Region ...................................................................... 84 Volume Analysis ....................................................... 84 Chart 32: Global Carbon Black Volume Market Analysis (2012–2022) by Geographic Region – North America, Europe, Asia-Pacific, South America and Rest of World in ‘000 Metric Tons ............................................................. 84 Chart 33: Glance at 2012, 2017 and 2022 Global Carbon Black Volume Market Share (%) by Geographic Region – North America, Europe, Asia-Pacific, South America and Rest of World .................................................................. 85 Value Analysis .......................................................... 86 Chart 34: Global Carbon Black Value Market Analysis (2012–2022) by Geographic Region – North America, Europe, Asia-Pacific, South America and Rest of World in USD Million ..................................................................... 86 Chart 35: Glance at 2012, 2017 and 2022 Global Carbon Black Value Market Share (%) by Geographic Region – North America, Europe, Asia-Pacific, South America and Rest of World .................................................................. 87 REGIONAL MARKET OVERVIEW ............................. 88 1. NORTH AMERICA .............................................. 88 Chart 36: North American Carbon Black Market Overview (2012-2022) in Volume (‘000 Metric Tons) and Value (USD Million) ............................................................................ 88 1.1 North American Carbon Black Market Overview by Geographic Region .............................................. 89 Volume Analysis ....................................................... 89 Chart 37: North American Carbon Black Volume Market Analysis (2012-2022) by Geographic Region – United States, Canada and Mexico in '000 Metric Tons .............. 89 Chart 38: Glance at 2012, 2017 and 2022 North American Carbon Black Volume Market Share (%) by Geographic Region – United States, Canada and Mexico ................... 90 Value Analysis .......................................................... 91 Chart 39: North American Carbon Black Value Market Analysis (2012-2022) by Geographic Region – United States, Canada and Mexico in USD Million ...................... 91 Chart 40: Glance at 2012, 2017 and 2022 North American Carbon Black Value Market Share (%) by Geographic Region – United States, Canada and Mexico ................... 92 1.2 North American Carbon Black Volume Market Overview by Application .......................................... 93 Chart 41: North American Carbon Black Volume Market Analysis (2012-2022) by Application – Industrial Rubber Products, Paints & Coatings, Plastics, Printing Inks & Toners and Tires in '000 Metric Tons .............................. 93 Chart 42: Glance at 2012, 2017 and 2022 North American Carbon Black Volume Market Share (%) by Application – Industrial Rubber Products, Paints & Coatings, Plastics, Printing Inks & Toners and Tires...................................... 94 1.2.1 Carbon Black Application Volume Market Overview by NA Region ........................................... 95 1.2.1.1 Industrial Rubber Products .......................... 95 Chart 43: North American Carbon Black Application in Industrial Rubber Products Volume Market Analysis (2012- 2022) by Geographic Region – United States, Canada and Mexico in '000 Metric Tons ............................................. 95 Chart 44: Glance at 2012, 2017 and 2022 North American Carbon Black Application in Industrial Rubber Products Volume Market Share (%) by Geographic Region – United States, Canada and Mexico ............................................. 96 1.2.1.2 Paints & Coatings ......................................... 97 Chart 45: North American Carbon Black Application in Paints & Coatings Volume Market Analysis (2012-2022) by Geographic Region – United States, Canada and Mexico in '000 Metric Tons ............................................................. 97 Chart 46: Glance at 2012, 2017 and 2022 North American Carbon Black Application in Paints & Coatings Volume Market Share (%) by Geographic Region – United States, Canada and Mexico ......................................................... 98 1.2.1.3 Plastics ......................................................... 99 Chart 47: North American Carbon Black Application in Plastics Volume Market Analysis (2012-2022) by Geographic Region – United States, Canada and Mexico in '000 Metric Tons ............................................................. 99 Chart 48: Glance at 2012, 2017 and 2022 North American Carbon Black Application in Plastics Volume Market Share (%) by Geographic Region – United States, Canada and Mexico .......................................................................... 100 1.2.1.4 Printing Inks & Toners ................................ 101 Chart 49: North American Carbon Black Application Printing Inks & Toners Volume Market Analysis (2012- 2022) in by Geographic Region – United States, Canada and Mexico in '000 Metric Tons .................................... 101 Chart 50: Glance at 2012, 2017 and 2022 North American Carbon Black Application in Printing Inks & Toners Volume Market Share (%) by Geographic Region – United States, Canada and Mexico ....................................................... 102 1.2.1.5 Tires ........................................................... 103 Chart 51: North American Carbon Black Application in Tires Volume Market Analysis (2012-2022) by Geographic Region – United States, Canada and Mexico in '000 Metric Tons .............................................................................. 103 Chart 52: Glance at 2012, 2017 and 2022 North American Carbon Black Application in Tires Volume Market Share (%) by Geographic Region – United States, Canada and Mexico .......................................................................... 104 1.3 North American Carbon Black Value Market Overview by Application ........................................ 105 Chart 53: North American Carbon Black Value Market Analysis (2012-2022) by Application – Industrial Rubber Products, Paints & Coatings, Plastics, Printing Inks & Toners and Tires in USD Million .................................... 105 Chart 54: Glance at 2012, 2017 and 2022 North American Carbon Black Value Market Share (%) by Application – Industrial Rubber Products, Paints & Coatings, Plastics, Printing Inks & Toners and Tires.................................... 106 1.3.1 Carbon Black Application Value Market Overview by NA Region ......................................... 107 1.3.1.1 Industrial Rubber Products ........................ 107 Chart 55: North American Carbon Black Application in Industrial Rubber Products Value Market Analysis (2012- 2022) by Geographic Region – United States, Canada and Mexico in USD Million .................................................. 107 Chart 56: Glance at 2012, 2017 and 2022 North American Carbon Black Application in Industrial Rubber Products Value Market Share (%) by Geographic Region – United States, Canada and Mexico ........................................... 108 1.3.1.2 Paints & Coatings ....................................... 109 Chart 57: North American Carbon Black Application in Paints & Coatings Value Market Analysis (2012-2022) by Geographic Region – United States, Canada and Mexico in USD Million ................................................................... 109 Chart 58: Glance at 2012, 2017 and 2022 North American Carbon Black Application in Paints & Coatings Value Market Share (%) by Geographic Region – United States, Canada and Mexico ...................................................... 110 1.3.1.3 Plastics ....................................................... 111 Chart 59: North American Carbon Black Application in Plastics Value Market Analysis (2012-2022) by Geographic Region – United States, Canada and Mexico in USD Million ............... 111 Chart 60: Glance at 2012, 2017 and 2022 North American Carbon Black Application in Plastics Value Market Share (%) by Geographic Region – United States, Canada and Mexico .......................................................................... 112 1.3.1.4 Printing Inks & Toners ................................ 113 Chart 61: North American Carbon Black Application Printing Inks & Toners Value Market Analysis (2012-2022) in by Geographic Region – United States, Canada and Mexico in USD Million .................................................. 113 Chart 62: Glance at 2012, 2017 and 2022 North American Carbon Black Application in Printing Inks & Toners Value Market Share (%) by Geographic Region – United States, Canada and Mexico ...................................................... 114 1.3.1.5 Tires ........................................................... 115 Chart 63: North American Carbon Black Application in Tires Value Market Analysis (2012-2022) by Geographic Region – United States, Canada and Mexico in USD Million............ 115 Chart 64: Glance at 2012, 2017 and 2022 North American Carbon Black Application in Tires Value Market Share (%) by Geographic Region – United States, Canada and Mexico .... 116 1.4 Major Market Players ...................................... 117 Cabot Corporation (United States) ............................... 117 Cancarb Limited (Canada) ............................................. 118 Continental Carbon Company (United States) .............. 119 Monolith Materials Inc (United States) ......................... 119 Sid Richardson Carbon and Energy Co Ltd (United States) ... 120 1.5 North American Carbon Black Market Overview by Country ............................................................. 122 1.5.1 The United States ....................................... 122 1.5.1.1 Market Overview by Application ............... 122 Volume Analysis .................................................... 122 Chart 65: United States Carbon Black Volume Market Analysis (2012-2022) by Application – Industrial Rubber Products, Paints & Coatings, Plastics, Printing Inks & Toners and Tires in '000 Metric Tons ............................ 122 Chart 66: Glance at 2012, 2017 and 2022 United States Carbon Black Volume Market Share (%) by Application – Industrial Rubber Products, Paints & Coatings, Plastics, Printing Inks & Toners and Tires ................................... 123 Value Analysis ........................................................ 124 Chart 67: United States Carbon Black Value Market Analysis (2012-2022) by Application – Industrial Rubber Products, Paints & Coatings, Plastics, Printing Inks & Toners and Tires in USD Million .................................... 124 Chart 68: Glance at 2012, 2017 and 2022 United States Carbon Black Value Market Share (%) by Application – Industrial Rubber Products, Paints & Coatings, Plastics, Printing Inks & Toners and Tires ................................... 125 1.5.2 Canada ....................................................... 126 1.5.2.1 Market Overview by Application ............... 126 Volume Analysis .................................................... 126 Click here to buy the report Page 4
Carbon Black – A Global Market Overview Jan 2016 |328 Pages | 240 Charts | Price $4050 Chart 69: Canadian Carbon Black Volume Market Analysis (2012-2022) by Application – Industrial Rubber Products, Paints & Coatings, Plastics, Printing Inks & Toners and Tires in '000 Metric Tons ............................................... 126 Chart 70: Glance at 2012, 2017 and 2022 Canadian Carbon Black Volume Market Share (%) by Application – Industrial Rubber Products, Paints & Coatings, Plastics, Printing Inks & Toners and Tires ........................................................ 127 Value Analysis ........................................................ 128 Chart 71: Canadian Carbon Black Value Market Analysis (2012-2022) by Application – Industrial Rubber Products, Paints & Coatings, Plastics, Printing Inks & Toners and Tires in USD Million ....................................................... 128 Chart 72: Glance at 2012, 2017 and 2022 Canadian Carbon Black Value Market Share (%) by Application – Industrial Rubber Products, Paints & Coatings, Plastics, Printing Inks & Toners and Tires ........................................................ 129 1.5.3 Mexico ....................................................... 130 1.5.3.1 Market Overview by Application ............... 130 Volume Analysis ..................................................... 130 Chart 73: Mexican Carbon Black Volume Market Analysis (2012-2022) by Application – Industrial Rubber Products, Paints & Coatings, Plastics, Printing Inks & Toners and Tires in '000 Metric Tons ............................................... 130 Chart 74: Glance at 2012, 2017 and 2022 Mexican Carbon Black Volume Market Share (%) by Application – Industrial Rubber Products, Paints & Coatings, Plastics, Printing Inks & Toners and Tires .................................... 131 Value Analysis ........................................................ 132 Chart 75: Mexican Carbon Black Value Market Analysis (2012-2022) by Application – Industrial Rubber Products, Paints & Coatings, Plastics, Printing Inks & Toners and Tires in USD Million ....................................................... 132 Chart 76: Glance at 2012, 2017 and 2022 Mexican Carbon Black Value Market Share (%) by Application – Industrial Rubber Products, Paints & Coatings, Plastics, Printing Inks & Toners and Tires ........................................................ 133 2. EUROPE .......................................................... 134 Chart 77: European Carbon Black Market Overview (2012-2022) in Volume (‘000 Metric Tons) and Value (USD Million) ............. 134 2.1 European Carbon Black Market Overview by Geographic Region................................................. 135 Volume Analysis ..................................................... 135 Chart 78: European Carbon Black Volume Market Analysis (2012-2022) by Geographic Region – France, Germany, Italy, Russia, Spain, United Kingdom and Rest of Europe in '000 Metric Tons............................................................ 135 Chart 79: Glance at 2012, 2017 and 2022 European Carbon Black Volume Market Share (%) by Geographic Region – France, Germany, Italy, Russia, Spain, United Kingdom and Rest of Europe ............................................................... 136 Value Analysis ........................................................ 137 Chart 80: European Carbon Black Value Market Analysis (2012-2022) by Geographic Region – France, Germany, Italy, Russia, Spain, United Kingdom and Rest of Europe in USD Million ................................................................... 137 Chart 81: Glance at 2012, 2017 and 2022 European Carbon Black Value Market Share (%) by Geographic Region – France, Germany, Italy, Russia, Spain, United Kingdom and Rest of Europe ............................................................... 138 2.2 European Carbon Black Volume Market Overview by Application ........................................................ 139 Chart 82: European Carbon Black Volume Market Analysis (2012-2022) by Application – Industrial Rubber Products, Paints & Coatings, Plastics, Printing Inks & Toners and Tires in '000 Metric Tons ............................................... 139 Chart 83: Glance at 2012, 2017 and 2022 European Carbon Black Volume Market Share (%) by Application – Industrial Rubber Products, Paints & Coatings, Plastics, Printing Inks & Toners and Tires ........................................................ 140 2.2.1 Carbon Black Application Volume Market Overview by European Region ............................... 141 2.2.1.1 Industrial Rubber Products ........................ 141 Chart 84: European Carbon Black Application in Industrial Rubber Products Volume Market Analysis (2012-2022) by Geographic Region – France, Germany, Italy, Russia, Spain, United Kingdom and Rest of Europe in '000 Metric Tons . 141 Chart 85: Glance at 2012, 2017 and 2022 European Carbon Black Application in Industrial Rubber Products Volume Market Share (%) by Geographic Region – France, Germany, Italy, Russia, Spain, United Kingdom and Rest of Europe .......................................................................... 142 2.2.1.2 Paints & Coatings ....................................... 143 Chart 86: European Carbon Black Application in Paints & Coatings Volume Market Analysis (2012-2022) by Geographic Region – France, Germany, Italy, Russia, Spain, United Kingdom and Rest of Europe in '000 Metric Tons . 143 Chart 87: Glance at 2012, 2017 and 2022 European Carbon Black Application in Paints & Coatings Volume Market Share (%) by Geographic Region – France, Germany, Italy, Russia, Spain, United Kingdom and Rest of Europe ....... 144 2.2.1.3 Plastics ....................................................... 145 Chart 88: European Carbon Black Application in Plastics Volume Market Analysis (2012-2022) by Geographic Region – France, Germany, Italy, Russia, Spain, United Kingdom and Rest of Europe in '000 Metric Tons.......... 145 Chart 89: Glance at 2012, 2017 and 2022 European Carbon Black Application in Plastics Volume Market Share (%) by Geographic Region – France, Germany, Italy, Russia, Spain, United Kingdom and Rest of Europe ............................. 146 2.2.1.4 Printing Inks & Toners ................................ 147 Chart 90: European Carbon Black Application Printing Inks & Toners Volume Market Analysis (2012-2022) in by Geographic Region – France, Germany, Italy, Russia, Spain, United Kingdom and Rest of Europe in '000 Metric Tons . 147 Chart 91: Glance at 2012, 2017 and 2022 European Carbon Black Application in Printing Inks & Toners Volume Market Share (%) by Geographic Region – France, Germany, Italy, Russia, Spain, United Kingdom and Rest of Europe ....... 148 2.2.1.5 Tires ........................................................... 149 Chart 92: European Carbon Black Application in Tires Volume Market Analysis (2012-2022) by Geographic Region – France, Germany, Italy, Russia, Spain, United Kingdom and Rest of Europe in '000 Metric Tons.......... 149 Chart 93: Glance at 2012, 2017 and 2022 European Carbon Black Application in Tires Volume Market Share (%) by Geographic Region – France, Germany, Italy, Russia, Spain, United Kingdom and Rest of Europe ............................. 150 2.3 European Carbon Black Value Market Overview by Application............................................................. 151 Chart 94: European Carbon Black Value Market Analysis (2012-2022) by Application – Industrial Rubber Products, Paints & Coatings, Plastics, Printing Inks & Toners and Tires in USD Million ....................................................... 151 Chart 95: Glance at 2012, 2017 and 2022 European Carbon Black Value Market Share (%) by Application – Industrial Rubber Products, Paints & Coatings, Plastics, Printing Inks & Toners and Tires.................................... 152 2.3.1 Carbon Black Application Value Market Overview by European Region ............................... 153 2.3.1.1 Industrial Rubber Products ........................ 153 Chart 96: European Carbon Black Application in Industrial Rubber Products Value Market Analysis (2012-2022) by Geographic Region – France, Germany, Italy, Russia, Spain, United Kingdom and Rest of Europe in USD Million ...... 153 Chart 97: Glance at 2012, 2017 and 2022 European Carbon Black Application in Industrial Rubber Products Value Market Share (%) by Geographic Region – France, Germany, Italy, Russia, Spain, United Kingdom and Rest of Europe .......................................................................... 154 2.3.1.2 Paints & Coatings ....................................... 155 Chart 98: European Carbon Black Application in Paints & Coatings Value Market Analysis (2012-2022) by Geographic Region – France, Germany, Italy, Russia, Spain, United Kingdom and Rest of Europe in USD Million ...... 155 Chart 99: Glance at 2012, 2017 and 2022 European Carbon Black Application in Paints & Coatings Value Market Share (%) by Geographic Region – France, Germany, Italy, Russia, Spain, United Kingdom and Rest of Europe ................... 156 2.3.1.3 Plastics ....................................................... 157 Chart 100: European Carbon Black Application in Plastics Value Market Analysis (2012-2022) by Geographic Region – France, Germany, Italy, Russia, Spain, United Kingdom and Rest of Europe in USD Million ................................ 157 Chart 101: Glance at 2012, 2017 and 2022 European Carbon Black Application in Plastics Value Market Share (%) by Geographic Region – France, Germany, Italy, Russia, Spain, United Kingdom and Rest of Europe .................. 158 2.3.1.4 Printing Inks & Toners ................................ 159 Chart 102: European Carbon Black Application Printing Inks & Toners Value Market Analysis (2012-2022) in by Geographic Region – France, Germany, Italy, Russia, Spain, United Kingdom and Rest of Europe in USD Million ..... 159 Chart 103: Glance at 2012, 2017 and 2022 European Carbon Black Application in Printing Inks & Toners Value Market Share (%) by Geographic Region – France, Germany, Italy, Russia, Spain, United Kingdom and Rest of Europe .......... 160 2.3.1.5 Tires ........................................................... 161 Chart 104: European Carbon Black Application in Tires Value Market Analysis (2012-2022) by Geographic Region – France, Germany, Italy, Russia, Spain, United Kingdom and Rest of Europe in USD Million ................................ 161 Chart 105: Glance at 2012, 2017 and 2022 European Carbon Black Application in Tires Value Market Share (%) by Geographic Region – France, Germany, Italy, Russia, Spain, United Kingdom and Rest of Europe .................. 162 2.4 Major Market Players ...................................... 163 Black Bear Carbon BV (The Netherlands) ...................... 163 Carbon Clean Tech AG (Germany) ................................ 164 Omsk Carbon Group OOO (Russia) ............................... 165 Orion Engineered Carbons SA (Luxembourg) ................ 167 PJSC Kremenchug Carbon Black Plant (Ukraine) ........... 168 2.5 European Carbon Black Market Overview by Country .................................................................. 169 2.5.1 France ........................................................ 169 2.5.1.1 Market Overview by Application ............... 169 Volume Analysis .................................................... 169 Chart 106: French Carbon Black Volume Market Analysis (2012-2022) by Application – Industrial Rubber Products, Paints & Coatings, Plastics, Printing Inks & Toners and Tires in '000 Metric Tons .............................................. 169 Chart 107: Glance at 2012, 2017 and 2022 French Carbon Black Volume Market Share (%) by Application – Industrial Rubber Products, Paints & Coatings, Plastics, Printing Inks & Toners and Tires ................................... 170 Value Analysis ........................................................ 171 Chart 108: French Carbon Black Value Market Analysis (2012-2022) by Application – Industrial Rubber Products, Paints & Coatings, Plastics, Printing Inks & Toners and Tires in USD Million ...................................................... 171 Chart 109: Glance at 2012, 2017 and 2022 French Carbon Black Value Market Share (%) by Application – Industrial Rubber Products, Paints & Coatings, Plastics, Printing Inks & Toners and Tires ................................... 172 2.5.2 Germany .................................................... 173 2.5.2.1 Market Overview by Application ............... 173 Volume Analysis .................................................... 173 Chart 110: German Carbon Black Volume Market Analysis (2012-2022) by Application – Industrial Rubber Products, Paints & Coatings, Plastics, Printing Inks & Toners and Tires in '000 Metric Tons .............................................. 173 Chart 111: Glance at 2012, 2017 and 2022 German Carbon Black Volume Market Share (%) by Application – Industrial Rubber Products, Paints & Coatings, Plastics, Printing Inks & Toners and Tires ................................... 174 Value Analysis ........................................................ 175 Chart 112: German Carbon Black Value Market Analysis (2012-2022) by Application – Industrial Rubber Products, Paints & Coatings, Plastics, Printing Inks & Toners and Tires in USD Million ...................................................... 175 Chart 113: Glance at 2012, 2017 and 2022 German Carbon Black Value Market Share (%) by Application – Industrial Rubber Products, Paints & Coatings, Plastics, Printing Inks & Toners and Tires........................................................ 176 2.5.3 Italy ........................................................... 177 2.5.3.1 Market Overview by Application ............... 177 Volume Analysis .................................................... 177 Chart 114: Italian Carbon Black Volume Market Analysis (2012-2022) by Application – Industrial Rubber Products, Paints & Coatings, Plastics, Printing Inks & Toners and Tires in '000 Metric Tons .............................................. 177 Click here to buy the report Page 5
Carbon Black – A Global Market Overview Jan 2016 |328 Pages | 240 Charts | Price $4050 Chart 115: Glance at 2012, 2017 and 2022 Italian Carbon Black Volume Market Share (%) by Application – Industrial Rubber Products, Paints & Coatings, Plastics, Printing Inks & Toners and Tires ........................................................ 178 Value Analysis ........................................................ 179 Chart 116: Italian Carbon Black Value Market Analysis (2012-2022) by Application – Industrial Rubber Products, Paints & Coatings, Plastics, Printing Inks & Toners and Tires in USD Million ....................................................... 179 Chart 117: Glance at 2012, 2017 and 2022 Italian Carbon Black Value Market Share (%) by Application – Industrial Rubber Products, Paints & Coatings, Plastics, Printing Inks & Toners and Tires ........................................................ 180 2.5.4 Russia ........................................................ 181 2.5.4.1 Market Overview by Application ............... 181 Volume Analysis ..................................................... 181 Chart 118: Russian Carbon Black Volume Market Analysis (2012-2022) by Application – Industrial Rubber Products, Paints & Coatings, Plastics, Printing Inks & Toners and Tires in '000 Metric Tons ............................................... 181 Chart 119: Glance at 2012, 2017 and 2022 Russian Carbon Black Volume Market Share (%) by Application – Industrial Rubber Products, Paints & Coatings, Plastics, Printing Inks & Toners and Tires ........................................................ 182 Value Analysis ........................................................ 183 Chart 120: Russian Carbon Black Value Market Analysis (2012-2022) by Application – Industrial Rubber Products, Paints & Coatings, Plastics, Printing Inks & Toners and Tires in USD Million ....................................................... 183 Chart 121: Glance at 2012, 2017 and 2022 Russian Carbon Black Value Market Share (%) by Application – Industrial Rubber Products, Paints & Coatings, Plastics, Printing Inks & Toners and Tires ........................................................ 184 2.5.5 Spain ......................................................... 185 2.5.5.1 Market Overview by Application ............... 185 Volume Analysis ..................................................... 185 Chart 122: Spanish Carbon Black Volume Market Analysis (2012-2022) by Application – Industrial Rubber Products, Paints & Coatings, Plastics, Printing Inks & Toners and Tires in '000 Metric Tons ............................................... 185 Chart 123: Glance at 2012, 2017 and 2022 Spanish Carbon Black Volume Market Share (%) by Application – Industrial Rubber Products, Paints & Coatings, Plastics, Printing Inks & Toners and Tires ........................................................ 186 Value Analysis ........................................................ 187 Chart 124: Spanish Carbon Black Value Market Analysis (2012-2022) by Application – Industrial Rubber Products, Paints & Coatings, Plastics, Printing Inks & Toners and Tires in USD Million ....................................................... 187 Chart 125: Glance at 2012, 2017 and 2022 Spanish Carbon Black Value Market Share (%) by Application – Industrial Rubber Products, Paints & Coatings, Plastics, Printing Inks & Toners and Tires ........................................................ 188 2.5.6 The United Kingdom .................................. 189 2.5.6.1 Market Overview by Application ............... 189 Volume Analysis ..................................................... 189 Chart 126: United Kingdom Carbon Black Volume Market Analysis (2012-2022) by Application – Industrial Rubber Products, Paints & Coatings, Plastics, Printing Inks & Toners and Tires in '000 Metric Tons ............................. 189 Chart 127: Glance at 2012, 2017 and 2022 United Kingdom Carbon Black Volume Market Share (%) by Application – Industrial Rubber Products, Paints & Coatings, Plastics, Printing Inks & Toners and Tires .................................... 190 Value Analysis ........................................................ 191 Chart 128: United Kingdom Carbon Black Value Market Analysis (2012-2022) by Application – Industrial Rubber Products, Paints & Coatings, Plastics, Printing Inks & Toners and Tires in USD Million ..................................... 191 Chart 129: Glance at 2012, 2017 and 2022 United Kingdom Carbon Black Value Market Share (%) by Application – Industrial Rubber Products, Paints & Coatings, Plastics, Printing Inks & Toners and Tires .................................... 192 2.5.7 Rest of Europe ........................................... 193 2.5.7.1 Market Overview by Application ............... 193 Volume Analysis ..................................................... 193 Chart 130: Rest of Europe Carbon Black Volume Market Analysis (2012-2022) by Application – Industrial Rubber Products, Paints & Coatings, Plastics, Printing Inks & Toners and Tires in '000 Metric Tons ............................ 193 Chart 131: Glance at 2012, 2017 and 2022 Rest of Europe Carbon Black Volume Market Share (%) by Application – Industrial Rubber Products, Paints & Coatings, Plastics, Printing Inks & Toners and Tires.................................... 194 Value Analysis ........................................................ 195 Chart 132: Rest of Europe Carbon Black Value Market Analysis (2012-2022) by Application – Industrial Rubber Products, Paints & Coatings, Plastics, Printing Inks & Toners and Tires in USD Million .................................... 195 Chart 133: Glance at 2012, 2017 and 2022 Rest of Europe Carbon Black Value Market Share (%) by Application – Industrial Rubber Products, Paints & Coatings, Plastics, Printing Inks & Toners and Tires.................................... 196 3.2.1.3 Plastics ....................................................... 208 Chart 145: Asia-Pacific Carbon Black Application in Plastics Volume Market Analysis (2012-2022) by Geographic Region – China, India, Indonesia, Japan, Taiwan, Thailand, South Korea and Rest of Asia-Pacific in '000 Metric Tons ........... 208 Chart 146: Glance at 2012, 2017 and 2022 Asia-Pacific Carbon Black Application in Plastics Volume Market Share (%) by Geographic Region – China, India, Indonesia, Japan, Taiwan, Thailand, South Korea and Rest of Asia-Pacific 209 3.2.1.4 Printing Inks & Toners ................................ 210 Chart 147: Asia-Pacific Carbon Black Application Printing Inks & Toners Volume Market Analysis (2012-2022) in by Geographic Region – China, India, Indonesia, Japan, Taiwan, Thailand, South Korea and Rest of Asia-Pacific in '000 Metric Tons ........................................................... 210 Chart 148: Glance at 2012, 2017 and 2022 Asia-Pacific Carbon Black Application in Printing Inks & Toners Volume Market Share (%) by Geographic Region – China, India, Indonesia, Japan, Taiwan, Thailand, South Korea and Rest of Asia-Pacific ............................................................... 211 3.2.1.5 Tires ........................................................... 212 Chart 149: Asia-Pacific Carbon Black Application in Tires Volume Market Analysis (2012-2022) by Geographic Region – China, India, Indonesia, Japan, Taiwan, Thailand, South Korea and Rest of Asia-Pacific in '000 Metric Tons ........... 212 Chart 150: Glance at 2012, 2017 and 2022 Asia-Pacific Carbon Black Application in Tires Volume Market Share (%) by Geographic Region – China, India, Indonesia, Japan, Taiwan, Thailand, South Korea and Rest of Asia-Pacific 213 3.3 Asia-Pacific Carbon Black Value Market Overview by Application ........................................................ 214 Chart 151: Asia-Pacific Carbon Black Value Market Analysis (2012-2022) by Application – Industrial Rubber Products, Paints & Coatings, Plastics, Printing Inks & Toners and Tires in USD Million ...................................................... 214 Chart 152: Glance at 2012, 2017 and 2022 Asia-Pacific Carbon Black Value Market Share (%) by Application – Industrial Rubber Products, Paints & Coatings, Plastics, Printing Inks & Toners and Tires ................................... 215 3.3.1 Carbon Black Application Value Market Overview by Asia-Pacific Region ............................ 216 3.3.1.1 Industrial Rubber Products ........................ 216 Chart 153: Asia-Pacific Carbon Black Application in Industrial Rubber Products Value Market Analysis (2012- 2022) by Geographic Region – China, India, Indonesia, Japan, Taiwan, Thailand, South Korea and Rest of Asia- Pacific in USD Million .................................................... 216 Chart 154: Glance at 2012, 2017 and 2022 Asia-Pacific Carbon Black Application in Industrial Rubber Products Value Market Share (%) by Geographic Region – China, India, Indonesia, Japan, Taiwan, Thailand, South Korea and Rest of Asia-Pacific ....................................................... 217 3.3.1.2 Paints & Coatings ....................................... 218 Chart 155: Asia-Pacific Carbon Black Application in Paints & Coatings Value Market Analysis (2012-2022) by Geographic Region – China, India, Indonesia, Japan, Taiwan, Thailand, South Korea and Rest of Asia-Pacific in USD Million ......... 218 Chart 156: Glance at 2012, 2017 and 2022 Asia-Pacific Carbon Black Application in Paints & Coatings Value Market Share (%) by Geographic Region – China, India, Indonesia, Japan, Taiwan, Thailand, South Korea and Rest of Asia-Pacific ............................................................... 219 3.3.1.3 Plastics ....................................................... 220 Chart 157: Asia-Pacific Carbon Black Application in Plastics Value Market Analysis (2012-2022) by Geographic Region – China, India, Indonesia, Japan, Taiwan, Thailand, South Korea and Rest of Asia-Pacific in USD Million ............... 220 Chart 158: Glance at 2012, 2017 and 2022 Asia-Pacific Carbon Black Application in Plastics Value Market Share (%) by Geographic Region – China, India, Indonesia, Japan, Taiwan, Thailand, South Korea and Rest of Asia-Pacific 221 3.3.1.4 Printing Inks & Toners ................................ 222 Chart 159: Asia-Pacific Carbon Black Application Printing Inks & Toners Value Market Analysis (2012-2022) in by Geographic Region – China, India, Indonesia, Japan, Taiwan, Thailand, South Korea and Rest of Asia-Pacific in USD Million ................................................................... 222 3. ASIA-PACIFIC ................................................... 197 Chart 134: Asia-Pacific Carbon Black Market Overview (2012-2022) in Volume (‘000 Metric Tons) and Value (USD Million) ......................................................................... 197 3.1 Asia-Pacific Carbon Black Market Overview by Geographic Region ................................................ 198 Volume Analysis..................................................... 198 Chart 135: Asia-Pacific Carbon Black Volume Market Analysis (2012-2022) by Geographic Region – China, India, Indonesia, Japan, Taiwan, Thailand, South Korea and Rest of Asia-Pacific in '000 Metric Tons ................................ 198 Chart 136: Glance at 2012, 2017 and 2022 Asia-Pacific Carbon Black Volume Market Share (%) by Geographic Region – China, India, Indonesia, Japan, Taiwan, Thailand, South Korea and Rest of Asia-Pacific ............................. 199 Value Analysis ........................................................ 200 Chart 137: Asia-Pacific Carbon Black Value Market Analysis (2012-2022) by Geographic Region – China, India, Indonesia, Japan, Taiwan, Thailand, South Korea and Rest of Asia-Pacific in USD Million ........................................ 200 Chart 138: Glance at 2012, 2017 and 2022 Asia-Pacific Carbon Black Value Market Share (%) by Geographic Region – China, India, Indonesia, Japan, Taiwan, Thailand, South Korea and Rest of Asia-Pacific ............................. 201 3.2 Asia-Pacific Carbon Black Volume Market Overview by Application ........................................ 202 Chart 139: Asia-Pacific Carbon Black Volume Market Analysis (2012-2022) by Application – Industrial Rubber Products, Paints & Coatings, Plastics, Printing Inks & Toners and Tires in '000 Metric Tons ............................ 202 Chart 140: Glance at 2012, 2017 and 2022 Asia-Pacific Carbon Black Volume Market Share (%) by Application – Industrial Rubber Products, Paints & Coatings, Plastics, Printing Inks & Toners and Tires.................................... 203 3.2.1 Carbon Black Application Volume Market Overview by Asia-Pacific Region ............................ 204 3.2.1.1 Industrial Rubber Products ........................ 204 Chart 141: Asia-Pacific Carbon Black Application in Industrial Rubber Products Volume Market Analysis (2012- 2022) by Geographic Region – China, India, Indonesia, Japan, Taiwan, Thailand, South Korea and Rest of Asia- Pacific in '000 Metric Tons ............................................ 204 Chart 142: Glance at 2012, 2017 and 2022 Asia-Pacific Carbon Black Application in Industrial Rubber Products Volume Market Share (%) by Geographic Region – China, India, Indonesia, Japan, Taiwan, Thailand, South Korea and Rest of Asia-Pacific ........................................................ 205 3.2.1.2 Paints & Coatings ....................................... 206 Chart 143: Asia-Pacific Carbon Black Application in Paints & Coatings Volume Market Analysis (2012-2022) by Geographic Region – China, India, Indonesia, Japan, Taiwan, Thailand, South Korea and Rest of Asia-Pacific in '000 Metric Tons ........................................................... 206 Chart 144: Glance at 2012, 2017 and 2022 Asia-Pacific Carbon Black Application in Paints & Coatings Volume Market Share (%) by Geographic Region – China, India, Indonesia, Japan, Taiwan, Thailand, South Korea and Rest of Asia-Pacific ................................................................ 207 Click here to buy the report Page 6
Carbon Black – A Global Market Overview Jan 2016 |328 Pages | 240 Charts | Price $4050 Chart 160: Glance at 2012, 2017 and 2022 Asia-Pacific Carbon Black Application in Printing Inks & Toners Value Market Share (%) by Geographic Region – China, India, Indonesia, Japan, Taiwan, Thailand, South Korea and Rest of Asia-Pacific ................................................................ 223 3.3.1.5 Tires ........................................................... 224 Chart 161: Asia-Pacific Carbon Black Application in Tires Value Market Analysis (2012-2022) by Geographic Region – China, India, Indonesia, Japan, Taiwan, Thailand, South Korea and Rest of Asia-Pacific in USD Million ................... 224 Chart 162: Glance at 2012, 2017 and 2022 Asia-Pacific Carbon Black Application in Tires Value Market Share (%) by Geographic Region – China, India, Indonesia, Japan, Taiwan, Thailand, South Korea and Rest of Asia-Pacific . 225 3.4 Major Market Players ...................................... 226 Asahi Carbon Co Ltd (Japan) .......................................... 226 Birla Carbon (India)........................................................ 227 China Synthetic Rubber Corporation (Taiwan) ............... 228 Continental Carbon Black India Ltd (India) .................... 228 Hebei Daguangming Ind. Group Co Ltd (China) ............. 229 Himadri Chemicals and Industries Limited (India) ......... 230 Jiangxi Black Cat Carbon Black Co Ltd (China) ................ 230 Jinneng Science and Technology Company Limited (China) . 231 Longxing Chemical Stock Co Ltd (China) ........................ 231 Mitsubishi Chemical Corporation (Japan) ...................... 232 Nippon Steel & Sumikin Chemical Co Ltd (Japan) .......... 232 OCI Company Ltd (South Korea) .................................... 233 Phillips Carbon Black Limited (India) .............................. 234 Qingzhou Boao Carbon Black Co Ltd (China).................. 235 Shandong Huadong Rubber Materials Co Ltd (China) .... 236 Shandong Lion King Carbon Black Co Ltd (China) ........... 237 Suzhou Baohua Carbon Black Co Ltd (China) ................. 238 Thai Tokai Carbon Product Company Limited (Thailand) ...... 239 Tokai Carbon Co Ltd (Japan) .......................................... 240 3.5 Asia-Pacific Carbon Black Market Overview by Country .................................................................. 241 3.5.1 China ......................................................... 241 3.5.1.1 Market Overview by Application ............... 241 Volume Analysis ..................................................... 241 Chart 163: Chinese Carbon Black Volume Market Analysis (2012-2022) by Application – Industrial Rubber Products, Paints & Coatings, Plastics, Printing Inks & Toners and Tires in '000 Metric Tons ............................................... 241 Chart 164: Glance at 2012, 2017 and 2022 Chinese Carbon Black Volume Market Share (%) by Application – Industrial Rubber Products, Paints & Coatings, Plastics, Printing Inks & Toners and Tires .................................... 242 Value Analysis ........................................................ 243 Chart 165: Chinese Carbon Black Value Market Analysis (2012-2022) by Application – Industrial Rubber Products, Paints & Coatings, Plastics, Printing Inks & Toners and Tires in USD Million ....................................................... 243 Chart 166: Glance at 2012, 2017 and 2022 Chinese Carbon Black Value Market Share (%) by Application – Industrial Rubber Products, Paints & Coatings, Plastics, Printing Inks & Toners and Tires .................................... 244 3.5.2 India .......................................................... 245 3.5.2.1 Market Overview by Application ............... 245 Volume Analysis ..................................................... 245 Chart 167: Indian Carbon Black Volume Market Analysis (2012-2022) by Application – Industrial Rubber Products, Paints & Coatings, Plastics, Printing Inks & Toners and Tires in '000 Metric Tons ............................................... 245 Chart 168: Glance at 2012, 2017 and 2022 Indian Carbon Black Volume Market Share (%) by Application – Industrial Rubber Products, Paints & Coatings, Plastics, Printing Inks & Toners and Tires .................................... 246 Value Analysis ........................................................ 247 Chart 169: Indian Carbon Black Value Market Analysis (2012-2022) by Application – Industrial Rubber Products, Paints & Coatings, Plastics, Printing Inks & Toners and Tires in USD Million ....................................................... 247 Chart 170: Glance at 2012, 2017 and 2022 Indian Carbon Black Value Market Share (%) by Application – Industrial Rubber Products, Paints & Coatings, Plastics, Printing Inks & Toners and Tires .................................... 248 Chart 186: Glance at 2012, 2017 and 2022 Thai Carbon Black Value Market Share (%) by Application – Industrial Rubber Products, Paints & Coatings, Plastics, Printing Inks & Toners and Tires ................................... 264 3.5.7 South Korea ............................................... 265 3.5.7.1 Market Overview by Application ............... 265 Volume Analysis .................................................... 265 Chart 187: South Korean Carbon Black Volume Market Analysis (2012-2022) by Application – Industrial Rubber Products, Paints & Coatings, Plastics, Printing Inks & Toners and Tires in '000 Metric Tons ............................ 265 Chart 188: Glance at 2012, 2017 and 2022 South Korean Carbon Black Volume Market Share (%) by Application – Industrial Rubber Products, Paints & Coatings, Plastics, Printing Inks & Toners and Tires ................................... 266 Value Analysis ........................................................ 267 Chart 189: South Korean Carbon Black Value Market Analysis (2012-2022) by Application – Industrial Rubber Products, Paints & Coatings, Plastics, Printing Inks & Toners and Tires in USD Million .................................... 267 Chart 190: Glance at 2012, 2017 and 2022 South Korean Carbon Black Value Market Share (%) by Application – Industrial Rubber Products, Paints & Coatings, Plastics, Printing Inks & Toners and Tires ................................... 268 3.5.8 Rest of Asia-Pacific ..................................... 269 3.5.8.1 Market Overview by Application ............... 269 Volume Analysis .................................................... 269 Chart 191: Rest of Asia-Pacific Carbon Black Volume Market Analysis (2012-2022) by Application – Industrial Rubber Products, Paints & Coatings, Plastics, Printing Inks & Toners and Tires in '000 Metric Tons ........................ 269 Chart 192: Glance at 2012, 2017 and 2022 Rest of Asia- Pacific Carbon Black Volume Market Share (%) by Application – Industrial Rubber Products, Paints & Coatings, Plastics, Printing Inks & Toners and Tires ...... 270 Value Analysis ........................................................ 271 Chart 193: Rest of Asia-Pacific Carbon Black Value Market Analysis (2012-2022) by Application – Industrial Rubber Products, Paints & Coatings, Plastics, Printing Inks & Toners and Tires in USD Million .................................... 271 Chart 194: Glance at 2012, 2017 and 2022 Rest of Asia- Pacific Carbon Black Value Market Share (%) by Application – Industrial Rubber Products, Paints & Coatings, Plastics, Printing Inks & Toners and Tires ...... 272 3.5.3 Indonesia ................................................... 249 3.5.3.1 Market Overview by Application ............... 249 Volume Analysis..................................................... 249 Chart 171: Indonesian Carbon Black Volume Market Analysis (2012-2022) by Application – Industrial Rubber Products, Paints & Coatings, Plastics, Printing Inks & Toners and Tires in '000 Metric Tons ............................ 249 Chart 172: Glance at 2012, 2017 and 2022 Indonesian Carbon Black Volume Market Share (%) by Application – Industrial Rubber Products, Paints & Coatings, Plastics, Printing Inks & Toners and Tires.................................... 250 Value Analysis ........................................................ 251 Chart 173: Indonesian Carbon Black Value Market Analysis (2012-2022) by Application – Industrial Rubber Products, Paints & Coatings, Plastics, Printing Inks & Toners and Tires in USD Million ....................................................... 251 Chart 174: Glance at 2012, 2017 and 2022 Indonesian Carbon Black Value Market Share (%) by Application – Industrial Rubber Products, Paints & Coatings, Plastics, Printing Inks & Toners and Tires.................................... 252 3.5.4 Japan ......................................................... 253 3.5.4.1 Market Overview by Application ............... 253 Volume Analysis..................................................... 253 Chart 175: Japanese Carbon Black Volume Market Analysis (2012-2022) by Application – Industrial Rubber Products, Paints & Coatings, Plastics, Printing Inks & Toners and Tires in '000 Metric Tons ............................................... 253 Chart 176: Glance at 2012, 2017 and 2022 Japanese Carbon Black Volume Market Share (%) by Application – Industrial Rubber Products, Paints & Coatings, Plastics, Printing Inks & Toners and Tires.................................... 254 Value Analysis ........................................................ 255 Chart 177: Japanese Carbon Black Value Market Analysis (2012-2022) by Application – Industrial Rubber Products, Paints & Coatings, Plastics, Printing Inks & Toners and Tires in USD Million ....................................................... 255 Chart 178: Glance at 2012, 2017 and 2022 Japanese Carbon Black Value Market Share (%) by Application – Industrial Rubber Products, Paints & Coatings, Plastics, Printing Inks & Toners and Tires.................................... 256 3.5.5 Taiwan ....................................................... 257 3.5.5.1 Market Overview by Application ............... 257 Volume Analysis..................................................... 257 Chart 179: Taiwanese Carbon Black Volume Market Analysis (2012-2022) by Application – Industrial Rubber Products, Paints & Coatings, Plastics, Printing Inks & Toners and Tires in '000 Metric Tons ............................ 257 Chart 180: Glance at 2012, 2017 and 2022 Taiwanese Carbon Black Volume Market Share (%) by Application – Industrial Rubber Products, Paints & Coatings, Plastics, Printing Inks & Toners and Tires.................................... 258 Value Analysis ........................................................ 259 Chart 181: Taiwanese Carbon Black Value Market Analysis (2012-2022) by Application – Industrial Rubber Products, Paints & Coatings, Plastics, Printing Inks & Toners and Tires in USD Million ....................................................... 259 Chart 182: Glance at 2012, 2017 and 2022 Taiwanese Carbon Black Value Market Share (%) by Application – Industrial Rubber Products, Paints & Coatings, Plastics, Printing Inks & Toners and Tires.................................... 260 3.5.6 Thailand ..................................................... 261 3.5.6.1 Market Overview by Application ............... 261 Volume Analysis..................................................... 261 Chart 183: Thai Carbon Black Volume Market Analysis (2012-2022) by Application – Industrial Rubber Products, Paints & Coatings, Plastics, Printing Inks & Toners and Tires in '000 Metric Tons ............................................... 261 Chart 184: Glance at 2012, 2017 and 2022 Thai Carbon Black Volume Market Share (%) by Application – Industrial Rubber Products, Paints & Coatings, Plastics, Printing Inks & Toners and Tires.................................... 262 Value Analysis ........................................................ 263 Chart 185: Thai Carbon Black Value Market Analysis (2012- 2022) by Application – Industrial Rubber Products, Paints & Coatings, Plastics, Printing Inks & Toners and Tires in USD Million ....................................................... 263 4. SOUTH AMERICA ............................................. 273 Chart 195: South American Carbon Black Market Overview (2012-2022) in Volume (‘000 Metric Tons) and Value (USD Million) ......................................................................... 273 4.1 South American Carbon Black Market Overview by Geographic Region ............................................ 274 Volume Analysis .................................................... 274 Chart 196: South American Carbon Black Volume Market Analysis (2012-2022) by Geographic Region – Argentina, Brazil and Rest of South America in '000 Metric Tons ... 274 Chart 197: Glance at 2012, 2017 and 2022 South American Carbon Black Volume Market Share (%) by Geographic Region – Argentina, Brazil and Rest of South America .. 275 Value Analysis ........................................................ 276 Chart 198: South American Carbon Black Value Market Analysis (2012-2022) by Geographic Region – Argentina, Brazil and Rest of South America in USD Million ........... 276 Chart 199: Glance at 2012, 2017 and 2022 South American Carbon Black Value Market Share (%) by Geographic Region – Argentina, Brazil and Rest of South America .. 277 4.2 South American Carbon Black Volume Market Overview by Application ........................................ 278 Chart 200: South American Carbon Black Volume Market Analysis (2012-2022) by Application – Industrial Rubber Products, Paints & Coatings, Plastics, Printing Inks & Toners and Tires in '000 Metric Tons ............................ 278 Chart 201: Glance at 2012, 2017 and 2022 South American Carbon Black Volume Market Share (%) by Application – Industrial Rubber Products, Paints & Coatings, Plastics, Printing Inks & Toners and Tires ................................... 279 4.2.1 Carbon Black Application Volume Market Overview by South American Region ..................... 280 Click here to buy the report Page 7
Carbon Black – A Global Market Overview Jan 2016 |328 Pages | 240 Charts | Price $4050 4.2.1.1 Industrial Rubber Products ........................ 280 Chart 202: South American Carbon Black Application in Industrial Rubber Products Volume Market Analysis (2012- 2022) by Geographic Region – Argentina, Brazil and Rest of South America in '000 Metric Tons ............................ 280 Chart 203: Glance at 2012, 2017 and 2022 South American Carbon Black Application in Industrial Rubber Products Volume Market Share (%) by Geographic Region – Argentina, Brazil and Rest of South America ................. 281 4.2.1.2 Paints & Coatings ....................................... 282 Chart 204: South American Carbon Black Application in Paints & Coatings Volume Market Analysis (2012-2022) by Geographic Region – Argentina, Brazil and Rest of South America in '000 Metric Tons .......................................... 282 Chart 205: Glance at 2012, 2017 and 2022 South American Carbon Black Application in Paints & Coatings Volume Market Share (%) by Geographic Region – Argentina, Brazil and Rest of South America ............................................ 283 4.2.1.3 Plastics ....................................................... 284 Chart 206: South American Carbon Black Application in Plastics Volume Market Analysis (2012-2022) by Geographic Region – Argentina, Brazil and Rest of South America in '000 Metric Tons .......................................... 284 Chart 207: Glance at 2012, 2017 and 2022 South American Carbon Black Application in Plastics Volume Market Share (%) by Geographic Region – Argentina, Brazil and Rest of South America ............................................................... 285 4.2.1.4 Printing Inks & Toners ................................ 286 Chart 208: South American Carbon Black Application Printing Inks & Toners Volume Market Analysis (2012- 2022) in by Geographic Region – Argentina, Brazil and Rest of South America in '000 Metric Tons ............................ 286 Chart 209: Glance at 2012, 2017 and 2022 South American Carbon Black Application in Printing Inks & Toners Volume Market Share (%) by Geographic Region – Argentina, Brazil and Rest of South America ............................................ 287 4.2.1.5 Tires ........................................................... 288 Chart 210: South American Carbon Black Application in Tires Volume Market Analysis (2012-2022) by Geographic Region – Argentina, Brazil and Rest of South America in '000 Metric Tons............................................................ 288 Chart 211: Glance at 2012, 2017 and 2022 South American Carbon Black Application in Tires Volume Market Share (%) by Geographic Region – Argentina, Brazil and Rest of South America ............................................................... 289 4.3 South American Carbon Black Value Market Overview by Application ........................................ 290 Chart 212: South American Carbon Black Value Market Analysis (2012-2022) by Application – Industrial Rubber Products, Paints & Coatings, Plastics, Printing Inks & Toners and Tires in USD Million ..................................... 290 Chart 213: Glance at 2012, 2017 and 2022 South American Carbon Black Value Market Share (%) by Application – Industrial Rubber Products, Paints & Coatings, Plastics, Printing Inks & Toners and Tires .................................... 291 4.3.1 Carbon Black Application Value Market Overview by South American Region ..................... 292 4.3.1.1 Industrial Rubber Products ........................ 292 Chart 214: South American Carbon Black Application in Industrial Rubber Products Value Market Analysis (2012- 2022) by Geographic Region – Argentina, Brazil and Rest of South America in USD Million.................................... 292 Chart 215: Glance at 2012, 2017 and 2022 South American Carbon Black Application in Industrial Rubber Products Value Market Share (%) by Geographic Region – Argentina, Brazil and Rest of South America ................. 293 4.3.1.2 Paints & Coatings ....................................... 294 Chart 216: South American Carbon Black Application in Paints & Coatings Value Market Analysis (2012-2022) by Geographic Region – Argentina, Brazil and Rest of South America in USD Million ................................................. 294 Chart 217: Glance at 2012, 2017 and 2022 South American Carbon Black Application in Paints & Coatings Value Market Share (%) by Geographic Region – Argentina, Brazil and Rest of South America ............................................ 295 4.3.1.3 Plastics ....................................................... 296 Chart 218: South American Carbon Black Application in Plastics Value Market Analysis (2012-2022) by Geographic Region – Argentina, Brazil and Rest of South America in USD Million ................................................................... 296 Chart 219: Glance at 2012, 2017 and 2022 South American Carbon Black Application in Plastics Value Market Share (%) by Geographic Region – Argentina, Brazil and Rest of South America .............................................................. 297 4.3.1.4 Printing Inks & Toners ................................ 298 Chart 220: South American Carbon Black Application Printing Inks & Toners Value Market Analysis (2012-2022) in by Geographic Region – Argentina, Brazil and Rest of South America in USD Million ....................................... 298 Chart 221: Glance at 2012, 2017 and 2022 South American Carbon Black Application in Printing Inks & Toners Value Market Share (%) by Geographic Region – Argentina, Brazil and Rest of South America ............................................ 299 4.3.1.5 Tires ........................................................... 300 Chart 222: South American Carbon Black Application in Tires Value Market Analysis (2012-2022) by Geographic Region – Argentina, Brazil and Rest of South America in USD Million ................................................................... 300 Chart 223: Glance at 2012, 2017 and 2022 South American Carbon Black Application in Tires Value Market Share (%) by Geographic Region – Argentina, Brazil and Rest of South America .............................................................. 301 4.4 South American Carbon Black Market Overview by Country ............................................................. 302 4.4.1 Argentina ................................................... 302 4.4.1.1 Market Overview by Application ............... 302 Volume Analysis..................................................... 302 Chart 224: Argentine Carbon Black Volume Market Analysis (2012-2022) by Application – Industrial Rubber Products, Paints & Coatings, Plastics, Printing Inks & Toners and Tires in '000 Metric Tons ............................ 302 Chart 225: Glance at 2012, 2017 and 2022 Argentine Carbon Black Volume Market Share (%) by Application – Industrial Rubber Products, Paints & Coatings, Plastics, Printing Inks & Toners and Tires.................................... 303 Value Analysis ........................................................ 304 Chart 226: Argentine Carbon Black Value Market Analysis (2012-2022) by Application – Industrial Rubber Products, Paints & Coatings, Plastics, Printing Inks & Toners and Tires in USD Million ....................................................... 304 Chart 227: Glance at 2012, 2017 and 2022 Argentine Carbon Black Value Market Share (%) by Application – Industrial Rubber Products, Paints & Coatings, Plastics, Printing Inks & Toners and Tires.................................... 305 4.4.2 Brazil .......................................................... 306 4.4.2.1 Market Overview by Application ............... 306 Volume Analysis..................................................... 306 Chart 228: Brazilian Carbon Black Volume Market Analysis (2012-2022) by Application – Industrial Rubber Products, Paints & Coatings, Plastics, Printing Inks & Toners and Tires in '000 Metric Tons ............................................... 306 Chart 229: Glance at 2012, 2017 and 2022 Brazilian Carbon Black Volume Market Share (%) by Application – Industrial Rubber Products, Paints & Coatings, Plastics, Printing Inks & Toners and Tires ................................... 307 Value Analysis ........................................................ 308 Chart 230: Brazilian Carbon Black Value Market Analysis (2012-2022) by Application – Industrial Rubber Products, Paints & Coatings, Plastics, Printing Inks & Toners and Tires in USD Million ...................................................... 308 Chart 231: Glance at 2012, 2017 and 2022 Brazilian Carbon Black Value Market Share (%) by Application – Industrial Rubber Products, Paints & Coatings, Plastics, Printing Inks & Toners and Tires ................................... 309 4.4.3 Rest of South America ................................ 310 4.4.3.1 Market Overview by Application ............... 310 Volume Analysis .................................................... 310 Chart 232: Rest of South America Carbon Black Volume Market Analysis (2012-2022) by Application – Industrial Rubber Products, Paints & Coatings, Plastics, Printing Inks & Toners and Tires in '000 Metric Tons ........................ 310 Chart 233: Glance at 2012, 2017 and 2022 Rest of South America Carbon Black Volume Market Share (%) by Application – Industrial Rubber Products, Paints & Coatings, Plastics, Printing Inks & Toners and Tires ...... 311 Value Analysis ........................................................ 312 Chart 234: Rest of South America Carbon Black Value Market Analysis (2012-2022) by Application – Industrial Rubber Products, Paints & Coatings, Plastics, Printing Inks & Toners and Tires in USD Million ................................ 312 Chart 235: Glance at 2012, 2017 and 2022 Rest of South America Carbon Black Value Market Share (%) by Application – Industrial Rubber Products, Paints & Coatings, Plastics, Printing Inks & Toners and Tires ...... 313 5. REST OF WORLD .............................................. 314 Chart 236: Rest of World Carbon Black Market Overview (2012- 2022) in Volume (‘000 Metric Tons) and Value (USD Million) .. 314 5.1 Market Overview by Application ..................... 315 Volume Analysis .................................................... 315 Chart 237: Rest of World Carbon Black Volume Market Analysis (2012-2022) by Application – Industrial Rubber Products, Paints & Coatings, Plastics, Printing Inks & Toners and Tires in '000 Metric Tons ............................ 315 Chart 238: Glance at 2012, 2017 and 2022 Rest of World Carbon Black Volume Market Share (%) by Application – Industrial Rubber Products, Paints & Coatings, Plastics, Printing Inks & Toners and Tires ................................... 316 Value Analysis ........................................................ 317 Chart 239: Rest of World Carbon Black Value Market Analysis (2012-2022) by Application – Industrial Rubber Products, Paints & Coatings, Plastics, Printing Inks & Toners and Tires in USD Million .................................... 317 Chart 240: Glance at 2012, 2017 and 2022 Rest of World Carbon Black Value Market Share (%) by Application – Industrial Rubber Products, Paints & Coatings, Plastics, Printing Inks & Toners and Tires ................................... 318 PART C: GUIDE TO THE INDUSTRY ............... 319 1. NORTH AMERICA ............................................ 319 2. EUROPE .......................................................... 320 3. ASIA-PACIFIC ................................................... 321 4. SOUTH AMERICA ............................................. 326 5. REST OF WORLD .............................................. 326 PART D: ANNEXURE .................................... 327 1. RESEARCH METHODOLOGY ............................. 327 2. FEEDBACK ....................................................... 329 Click here to buy the report Page 8
Carbon Black – A Global Market Overview Jan 2016 |328 Pages | 240 Charts | Price $4050 About Industry Experts Industry Experts values the most updated and accurate market research and industry analysis to provide unique market research reports for a broad range of industry verticals including Automotive, Transportation, Healthcare, Pharmaceuticals, Food & Beverages, Chemicals, Plastics, Materials, Consumer Goods, Retail, Biotechnology, Construction, Manufacturing and Other industries. Our research reports help our clients to identify and resolve topical issues by providing a complete picture of the market in their respective industry sectors. The Company’s rich collection of market research reports enable the companies to explore market drivers; forecast the future market; and to formulate the right strategies at the right time. INDUSTRY EXPERTS 1-7-19/C, Street No. 8, Habsiguda Hyderabad – 500007, India Phone: +91-40-4018-1314 Fax: +91-40-4027-2381 info@industry-experts.com industry-experts.com Industry Experts’ leading edge publications makes the life easy for corporate strategists, investors, analysts and researchers, start ups, consultants, financial and banking executives, academicians and many more. The company also provides customized research reports to cater the needs of the industry. More about Industry Experts Click here to buy the report Page 9