Download
1 / 13
130 likes | 180 Vues
Fluoropolymers’ exceptional properties, such as outstanding chemical resistance, weather stability, low surface energy, low coefficient of friction, and low dielectric constant, have attributed to their widespread usage in sectors such as chemical processing, electrical & electronics, automotive, building & construction and medical among others.

E N D
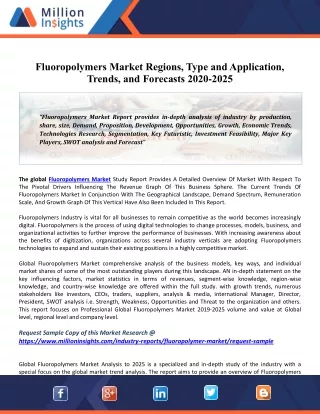
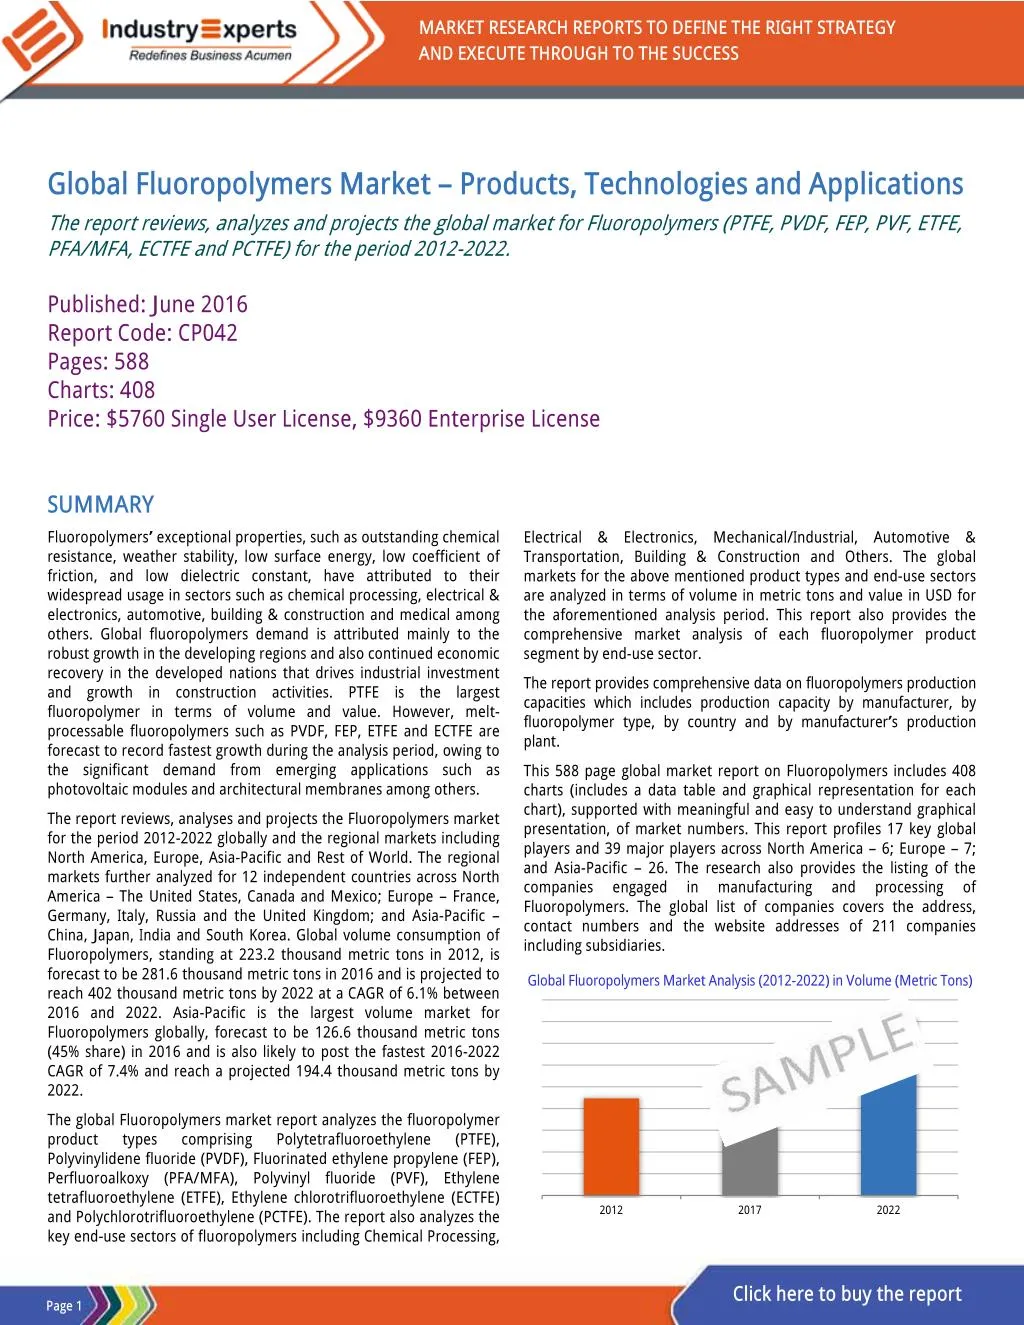
MARKET RESEARCH REPORTS TO DEFINE THE RIGHT STRATEGY AND EXECUTE THROUGH TO THE SUCCESS Global Fluoropolymers Market – Products, Technologies and Applications The report reviews, analyzes and projects the global market for Fluoropolymers (PTFE, PVDF, FEP, PVF, ETFE, PFA/MFA, ECTFE and PCTFE) for the period 2012-2022. Published: June 2016 Report Code: CP042 Pages: 588 Charts: 408 Price: $5760 Single User License, $9360 Enterprise License SUMMARY Fluoropolymers’ exceptional properties, such as outstanding chemical resistance, weather stability, low surface energy, low coefficient of friction, and low dielectric constant, have attributed to their widespread usage in sectors such as chemical processing, electrical & electronics, automotive, building & construction and medical among others. Global fluoropolymers demand is attributed mainly to the robust growth in the developing regions and also continued economic recovery in the developed nations that drives industrial investment and growth in construction activities. PTFE is the largest fluoropolymer in terms of volume and value. However, melt- processable fluoropolymers such as PVDF, FEP, ETFE and ECTFE are forecast to record fastest growth during the analysis period, owing to the significant demand from emerging applications such as photovoltaic modules and architectural membranes among others. Electrical & Electronics, Mechanical/Industrial, Automotive & Transportation, Building & Construction and Others. The global markets for the above mentioned product types and end-use sectors are analyzed in terms of volume in metric tons and value in USD for the aforementioned analysis period. This report also provides the comprehensive market analysis of each fluoropolymer product segment by end-use sector. The report provides comprehensive data on fluoropolymers production capacities which includes production capacity by manufacturer, by fluoropolymer type, by country and by manufacturer’s production plant. This 588 page global market report on Fluoropolymers includes 408 charts (includes a data table and graphical representation for each chart), supported with meaningful and easy to understand graphical presentation, of market numbers. This report profiles 17 key global players and 39 major players across North America – 6; Europe – 7; and Asia-Pacific – 26. The research also provides the listing of the companies engaged in manufacturing Fluoropolymers. The global list of companies covers the address, contact numbers and the website addresses of 211 companies including subsidiaries. The report reviews, analyses and projects the Fluoropolymers market for the period 2012-2022 globally and the regional markets including North America, Europe, Asia-Pacific and Rest of World. The regional markets further analyzed for 12 independent countries across North America – The United States, Canada and Mexico; Europe – France, Germany, Italy, Russia and the United Kingdom; and Asia-Pacific – China, Japan, India and South Korea. Global volume consumption of Fluoropolymers, standing at 223.2 thousand metric tons in 2012, is forecast to be 281.6 thousand metric tons in 2016 and is projected to reach 402 thousand metric tons by 2022 at a CAGR of 6.1% between 2016 and 2022. Asia-Pacific is the largest volume market for Fluoropolymers globally, forecast to be 126.6 thousand metric tons (45% share) in 2016 and is also likely to post the fastest 2016-2022 CAGR of 7.4% and reach a projected 194.4 thousand metric tons by 2022. and processing of Global Fluoropolymers Market Analysis (2012-2022) in Volume (Metric Tons) The global Fluoropolymers market report analyzes the fluoropolymer product types comprising Polyvinylidene fluoride (PVDF), Fluorinated ethylene propylene (FEP), Perfluoroalkoxy (PFA/MFA), Polyvinyl fluoride (PVF), Ethylene tetrafluoroethylene (ETFE), Ethylene chlorotrifluoroethylene (ECTFE) and Polychlorotrifluoroethylene (PCTFE). The report also analyzes the key end-use sectors of fluoropolymers including Chemical Processing, Polytetrafluoroethylene (PTFE), 2012 2017 2022 Click here to buy the report Page 1
Global Fluoropolymers Market – Products, Technologies and Applications June 2016 |588 Pages | 408 Charts | Price $5760 SAMPLE TABLE/CHART 2017 Global Fluoropolymers Volume Market Share (%) by Geographic Region – North America, Europe, Asia-Pacific and Rest of World SAMPLE COMPANY PROFILE HALOPOLYMER OJSC (RUSSIA) Leningradskiy Prospect, MonArch Business Center, 31A, Building 1, 15th Floor, 125284, Moscow, Russia Phone: +7 (495) 725-44-00 www.halopolymer.com Business Profile Moscow, Russia-based HaloPolymer OJSC stands among the leading global producers of fluoropolymer products and the sole Russian producer of specialized fluoropolymers (melt processable fluoroplastics and fluoroprenes). The company is also the largest regional producer of freons and a leader in producing inorganic chemicals, such as acids, alkalis and salts. As of 2011, HaloPolymer’s production capacity of polytetrafluoroethylene (PTFE) stood at 12,700 tons per annum, with exports of the same accounting for 80% to over 30 countries, including the USA. Apart from PTFE, HaloPolymer produces small fluoropolymers such as FEP and PVDF. The company’s enterprises include HaloPolymer Perm OJSC, HaloPolymer Kirovo-Chepetsk LLC and HaloPolymer Logistics LLC. Global Market for Fluoropolymers in Building & Construction Sector (2016 & 2022) by Fluoropolymer Type – PTFE, PVDF, ETFE, PVF and ECTFE in Metric Tons amounts of other Product Portfolio HaloPolymer product portfolio includes PTFE, FEP, ETFE, PVDF and fluoroelastomers. PTFE • • • • • • Fluoroplast-4 – easily lumping white powder Fluoroplast-4А – free flowing white powder Fluoroplast-4D – suspensions, powders and fine powders Fluoroplast-4M – modified PTFE powders Fluoroplast-4ТG - pre-sintered PTFE powder PTFE-4D and PTFE-4MD suspensions KEY PLAYERS PROFILED •3M Company •Arkema Group •Asahi Glass Co Ltd •Daikin Industries Ltd •Dongyue Group Limited •E. I. Du Pont De Nemours and Company •Gujarat Fluorochemicals Limited •HaloPolymer OJSC •Honeywell International Inc. •Jiangsu Meilan Chemical Co Ltd •Jinhua Yonghe Fluorochemical Co Ltd •Kureha Corporation •Shanghai 3F New Material Co Ltd •Solvay SA •The Chemours Company •Zhejiang Juhua Co Ltd •Zhonghao Chenguang Research Institute Chemical Industry Other Fluoropolymers • Fluoroplast-2M – modified PVDF granules and powders • Fluoroplast-32L – PVDF copolymer powders • Fluoroplast-42 – PVDF copolymer granules and powders • Fluoroplast-4MB – FEP granules and powders • Fluoroplast-40 – ETFE granules and powders • Fluoroplast-40M – modified ETFE granules and powders …………………….more …………………….more Click here to buy the report Page 2
Global Fluoropolymers Market – Products, Technologies and Applications June 2016 |588 Pages | 408 Charts | Price $5760 TABLE OF CONTENTS 1.1.2.4 Perfluoroalkoxy (PFA/MFA) ....................... 36 1.1.2.4.1 Structure and Properties of PFA/MFA....... 36 Figure 4: Chemical Structure of PFA ................................ 36 Table 7: Typical Properties of PFA ................................... 37 1.1.2.4.2 Manufacturing Process of PFA/MFA ......... 38 1.1.2.4.3 Applications and End-Use Sectors of PFA/MFA . 39 1.1.2.4.3.1 Automotive & Transportation ................ 39 1.1.2.4.3.2 Chemical Processing .............................. 39 1.1.2.4.3.3 Electrical & Electronics ........................... 40 1.1.2.4.3.4 PFA/MFA for Coatings ............................ 41 1.1.2.4.3.5 Industrial and Other Sectors .................. 41 1.1.2.5 Polyvinyl Fluoride (PVF) ............................. 42 1.1.2.5.1 Structure and Properties of PVF ............... 42 Figure 5: Chemical Structure of PVF ................................ 42 1.1.2.5.2 Manufacturing Process of PVF .................. 43 1.1.2.5.2.1 Synthesis of Vinyl Fluoride (VF) .............. 43 1.1.2.5.2.2 Production Process of PVF ..................... 43 Figure 6: Polymerization of VF ........................................ 44 1.1.2.5.3 Applications and End-Use Sectors of PVF.. 44 1.1.2.5.3.1 Automotive & Transportation ................ 44 1.1.2.5.3.2 Building & Construction ......................... 44 1.1.2.5.3.3 Electrical & Electronics ........................... 45 1.1.2.5.3.4 Industrial and Other Applications .......... 45 1.1.2.6 Ethylene Tetrafluoroethylene (ETFE) .......... 45 1.1.2.6.1 Structure and Properties of ETFE .............. 46 Figure 7: Chemical Structure of ETFE .............................. 46 Table 8: Typical Properties of ETFE ................................. 46 1.1.2.6.2 Manufacturing Process of ETFE ................. 47 Figure 8: ETFE Preparation Process ................................. 47 1.1.2.6.3 Applications and End-Use Sectors of ETFE 47 1.1.2.7 Ethylene Chlorotrifluoroethylene (ECTFE) .. 48 1.1.2.7.1 Structure and Properties of ECTFE ............ 48 Figure 9: Chemical Structure of ECTFE ............................ 48 Table 9: Typical Properties of ECTFE ............................... 49 1.1.2.7.2 Manufacturing Process of ECTFE .............. 49 Figure 10: ECTFE Preparation Process ............................. 49 1.1.2.7.2.1 Synthesis of Chlorotrifluoroethylene (CTFE) ... 50 1.1.2.7.2.2 Production Process of ECTFE .................. 50 1.1.2.7.3 Applications and End-Use Sectors of ECTFE .... 51 1.1.2.7.3.1 Automotive & Transportation ................ 51 1.1.2.7.3.2 Building & Construction ......................... 51 1.1.2.7.3.3 Chemical Processing .............................. 51 1.1.2.7.3.4 Electrical & Electronics ........................... 52 1.1.2.7.3.5 Mechanical/Industrial ............................ 52 1.1.2.8 Polychlorotrifluoroethylene (PCTFE) .......... 53 1.1.2.8.1 Structure and Properties of PCTFE ............ 53 Figure 11: Chemical Structure of PCTFE .......................... 53 Table 10: Typical Properties of PCTFE ............................. 54 1.1.2.8.2 Manufacturing Process of PCTFE .............. 54 Figure 12: CTFE Polymerization Process .......................... 54 1.1.2.8.3 Applications and End-Use Sectors of PCTFE .... 55 1.1.2.9 Other Fluoropolymers ............................... 56 1.1.2.9.1 FEVE: Copolymer of Fluoroethylene (FE) and Vinyl Ether (VE) ........................................................ 56 1.1.2.9.2 THV: Terpolymer of Tetrafluoroethylene (TFE), Hexafluoropropylene (HFP), and Vinylidene Fluoride (VDF) .......................................................... 56 1.1.2.9.3 HTE: Terpolymer of Hexafluoropropylene (HFP), Tetrafluoroethylene (TFE) and Ethylene ....... 57 1.1.2.9.4 CPT: Terpolymer of Chlorotrifluoroethylene (CTFE), Perfluoroalkylvinylether (PAVE) and Tetrafluoroethylene (TFE) ........................................ 57 1.1.2.9.5 EFEP: Terpolymer of Ethylene, Tetrafluoroethylene (TFE) and Hexafluoropropylene (HFP) ........................................................................ 57 1.1.2.9.6 Amorphous Fluoropolymers (CYTOP, Teflon- AF, Hyflon-AD) ......................................................... 57 2. END-USE SECTOR ANALYSIS ............................... 59 Chart 3: Global Fluoropolymers Market Analysis (2016 & 2022) by End-use Sector – Chemical Processing, Electrical & Electronics, Mechanical/Industrial, Automotive &Transportation, Building & Construction and Others in Metric Tons .................................................................... 59 2.1 Chemical Processing Sector ............................... 60 By Geographic Region .............................................. 60 Chart 4: Global Market for Fluoropolymers in Chemical Processing Sector (2016 & 2022) by Geographic Region – North America, Europe, Asia-Pacific and Rest of World in Metric Tons .................................................................... 60 By Fluoropolymer Type ............................................ 61 Chart 5: Global Market for Fluoropolymers in Chemical Processing Sector (2016 & 2022) by Fluoropolymer Type – PTFE, FEP, PVDF, ETFE, PFA, PCTFE and ECTFE in Metric Tons ................................................................................ 61 2.2 Electrical & Electronics Sector ........................... 62 By Geographic Region .............................................. 62 Chart 6: Global Market for Fluoropolymers in Electrical & Electronics Sector (2016 & 2022) by Geographic Region – North America, Europe, Asia-Pacific and Rest of World in Metric Tons .................................................................... 62 By Fluoropolymer Type ............................................ 63 Chart 7: Global Market for Fluoropolymers in Electrical & Electronics Sector (2016 &2022) by Fluoropolymer Type – PTFE, FEP, PVDF, ETFE, PFA, PVF, PCTFE and ECTFE in Metric Tons .................................................................... 63 2.3 Mechanical/Industrial Sector ............................. 64 By Geographic Region .............................................. 64 Chart 8: Global Market for Fluoropolymers in Mechanical/Industrial Sector (2016 & 2022) by Geographic Region – North America, Europe, Asia-Pacific and Rest of World in Metric Tons ...................................................... 64 By Fluoropolymer Type ............................................ 65 Chart 9: Global Market for Fluoropolymers in Mechanical/Industrial Sector (2016 &2022) by Fluoropolymer Type – PTFE, FEP, PVDF, ETFE, PFA, PVF, PCTFE and ECTFE in Metric Tons ..................................... 65 2.4 Automotive & Transportation Sector ................. 66 By Geographic Region .............................................. 66 Chart 10: Global Market for Fluoropolymers in Automotive & Transportation Sector (2016 & 2022) by Geographic Region – North America, Europe, Asia-Pacific and Rest of World in Metric Tons ...................................................... 66 By Fluoropolymer Type ............................................ 67 Chart 11: Global Market for Fluoropolymers in Automotive & Transportation Sector (2016 &2022) by Fluoropolymer Type – PTFE, FEP, PVDF, ETFE, PFA, PVF and ECTFE in Metric Tons .................................................................... 67 2.5 Building & Construction Sector .......................... 68 By Geographic Region .............................................. 68 Chart 12: Global Market for Fluoropolymers in Building & Construction Sector (2016 & 2022) by Geographic Region – North America, Europe, Asia-Pacific and Rest of World in Metric Tons .................................................................... 68 By Fluoropolymer Type ............................................ 69 Chart 13: Global Market for Fluoropolymers in Building & Construction Sector (2016 &2022) by Fluoropolymer Type – PTFE, PVDF, ETFE, PVF and ECTFE in Metric Tons......... 69 2.6 Other Sectors ..................................................... 70 By Geographic Region .............................................. 70 Chart 14: Global Market for Fluoropolymers in Other Sectors (2016 & 2022) by Geographic Region – North America, Europe, Asia-Pacific and Rest of World in Metric Tons ........................ 70 By Fluoropolymer Type ............................................ 71 Chart 15: Global Market for Fluoropolymers in Other Sectors (2016 &2022) by Fluoropolymer Type – PTFE, FEP, PVDF, ETFE, PFA, PVF, PCTFE and ECTFE in Metric Tons . 71 3. KEY MARKET TRENDS ........................................ 72 3.1 Medical Device Industry Fuelling Demand for Fluoropolymers ....................................................... 72 PART A: GLOBAL MARKET PERSPECTIVE ........ 1 1. INTRODUCTION .................................................. 1 Chart 1: Global Fluoropolymers Market 2012, 2016 and 2022 ......... 1 Chart 2: Global Fluoropolymers Market 2016 and 2022 by Geographic Region ........................................................... 2 1.1 Product Outline .................................................... 4 1.1.1 Fluoropolymers ................................................. 4 1.1.1.1 General Properties of Fluoropolymers ........... 4 1.1.2 Types of Fluoropolymers .................................. 5 Table 1: Fluoropolymers Types ......................................... 6 Table 2: Monomers Used in Commercial Fluoropolymers 6 Table 3: Major Fluoropolymers and their Monomers ....... 7 1.1.2.1 Polytetrafluoroethylene (PTFE) ................... 7 1.1.2.1.1 Structure and Properties of PTFE ................ 8 Figure 1: TFE Polymerization ............................................ 8 Table 4: Typical Properties of PTFE ..................................10 1.1.2.1.2 Manufacturing Processes of PTFE ............. 11 1.1.2.1.2.1 Synthesis of Tetrafluoroethylene (TFE) .. 11 1.1.2.1.2.2 Production of Polytetrafluoroethylene (PTFE) ....................................................................... 12 1.1.2.1.3 PTFE Forms and Applications .................... 13 1.1.2.1.3.1 Applications of Granular PTFE ................ 13 1.1.2.1.3.2 Applications of PTFE Find Powders ........ 14 1.1.2.1.3.2.1 Tubing, Pressure Hoses and Pipe-Liners .... 15 1.1.2.1.3.2.2 Wire Insulation.................................... 15 1.1.2.1.3.2.3 Mechanical & Electrical Tapes ............ 16 1.1.2.1.3.2.4 Membranes ......................................... 16 1.1.2.1.3.2.5 Fibers .................................................. 16 1.1.2.1.3.3 Applications of PTFE Aqueous Dispersions ... 17 1.1.2.1.3.3.1 Flexible Roofing Materials ................... 17 1.1.2.1.3.3.2 Electrical, Electronics and Semiconductors ....................................................... 17 1.1.2.1.3.3.3 Filtration ............................................. 17 1.1.2.1.3.3.4 Food Processing .................................. 17 1.1.2.1.3.4 Applications of PTFE Micronized Powders ... 18 1.1.2.1.3.4.1 Aircraft & Aerospace ........................... 19 1.1.2.1.3.4.2 Building & Construction ...................... 19 1.1.2.1.3.4.3 Chemical Process Industry .................. 19 1.1.2.1.3.4.4 Electrical & Electronics ........................ 19 1.1.2.1.3.4.5 Consumer Goods................................. 19 1.1.2.2 Fluorinated Ethylene Propylene (FEP) ........ 20 1.1.2.2.1 Structure and Properties of FEP ................ 20 Figure 2: Preparation of FEP ............................................20 Table 5: Typical Properties of FEP ....................................21 1.1.2.2.2 Manufacturing Process of FEP .................. 22 1.1.2.2.2.1 Synthesis of Hexafluoropropylene (HFP) 22 1.1.2.2.2.2 Production of Fluorinated Ethylene Propylene (FEP) ....................................................... 22 1.1.2.2.3 FEP Forms and Applications ...................... 23 1.1.2.2.3.1 FEP Pellets/Granules .............................. 23 1.1.2.2.3.2 FEP Dispersions &Coating Powders ....... 23 1.1.2.2.3.3 FEP Film ................................................. 24 1.1.2.3 Polyvinylidene Fluoride (PVDF) .................. 24 1.1.2.3.1 Structure and Properties of PVDF ............. 25 Figure 3: Chemical Structure of PVDF ..............................25 Table 6: Typical Properties of PVDF .................................27 1.1.2.3.2 Manufacturing Process of PVDF ................ 28 1.1.2.3.2.1 Synthesis of VDF .................................... 28 1.1.2.3.2.2 Production Processes of PVDF ............... 28 1.1.2.3.3 Applications and End-Use Sectors of PVDF 29 1.1.2.3.3.1 Automotive & Transportation ................ 30 1.1.2.3.3.2 Building & Construction ......................... 30 1.1.2.3.3.3 Chemical Processing .............................. 31 1.1.2.3.3.4 Electrical & Electronics ........................... 32 1.1.2.3.3.5 Industrial Applications ........................... 33 1.1.2.3.3.6 Other End-Use Sectors ........................... 35 Click here to buy the report Page 3
Global Fluoropolymers Market – Products, Technologies and Applications June 2016 |588 Pages | 408 Charts | Price $5760 Medical and Biomedical Sectors Fertile Grounds for PVDF ........................................................................ 73 3.2 Demand for PTFE to Gain Further Momentum from Products with Improved Properties ................ 75 Modified PTFE .......................................................... 75 Expanded PTFE ........................................................ 76 Micronized PTFE Powders ....................................... 78 3.3 New Energy Markets to Take PVDF in a Big Way 79 Photovoltaics ........................................................... 79 Lithium-Ion Batteries ............................................... 80 3.4 Demands of Membrane Market Being Addressed by PVDF ................................................................... 82 PVDF Membrane Applications ................................. 82 3.5 ETFE’s Progress in Architectural Applications Gains Prominence .................................................... 83 3.6 Bright Opportunities for Fluoropolymers in the Radiant Solar Modules Market ................................ 85 4. INDUSTRY LANDSCAPE ...................................... 89 4.1 Fluoropolymers Producers and Production Capacities ............................................................. 89 Table 11: Fluoropolymer Product Portfolio of Major Producers ..... 89 Chart 16: 2015 Estimated Global Fluoropolymers Production Capacities (Metric Tons/Year) by Company...90 Chart 17: 2015 Estimated Global Fluoropolymers Production Capacities (Metric Tons/Year) by Country/Region ...............................................................91 4.1.1 Fluoropolymers Production Capacities by Fluoropolymer Type................................................. 91 Chart 18: 2015 Estimated Global Fluoropolymers Production Capacities (Metric Tons /Year) by Fluoropolymer Type ........................................................91 4.1.1.1 Polytetrafluoroethylene (PTFE) .................... 92 Chart 19: 2015 Global Polytetrafluoroethylene (PTFE) Estimated Capacities (Metric Tons/Year) by Company ....92 Chart 20: 2015 Global Polytetrafluoroethylene (PTFE) Estimated Capacities (Metric Tons/Year) by Country/Region ...............................................................92 Chart 21: Polytetrafluoroethylene (PTFE) Producers’ Plant- wise Production Capacities ..............................................93 4.1.1.2 Fluorinated Ethylene Propylene (FEP) .......... 94 Chart 22: 2015 Global Fluorinated Ethylene Propylene (FEP) Estimated Capacities (Metric Tons/Year) by Company ....... 94 Chart 23: 2015 Global Fluorinated Ethylene Propylene (FEP) Estimated Capacities (Metric Tons/Year) by Country/Region ...............................................................94 Chart 24: Fluorinated Ethylene Propylene (FEP) Producers’ Plant-wise Production Capacities ....................................95 4.1.1.3 Polyvinylidene Fluoride (PVDF) .................... 95 Chart 25: 2015 Global Polyvinylidene Fluoride (PVDF) Estimated Capacities (Metric Tons/Year) by Company ....95 Chart 26: 2015 Global Polyvinylidene Fluoride (PVDF) Estimated Capacities (Metric Tons/Year) by Country ......96 Chart 27: Polyvinylidene Fluoride (PVDF) Producers’ Plant- wise Production Capacities ..............................................96 4.1.1.4 Ethylene tetrafluoroethylene (ETFE) ............ 97 Chart 28: 2015 Global Ethylene tetrafluoroethylene (ETFE) Estimated Capacities (Metric Tons/Year) by Company ....97 Chart 29: 2015 Global Ethylene tetrafluoroethylene (ETFE) Estimated Capacities (Metric Tons/Year) by Country/Region ...............................................................97 Chart 30: Ethylene tetrafluoroethylene (ETFE) Producers’ Plant-wise Production Capacities ....................................97 4.1.1.5 Perfluoroalkoxy (PFA/MFA) ......................... 98 Chart 31: 2015 Global Perfluoroalkoxy (PFA) Estimated Capacities (Metric Tons/Year) by Company .....................98 Chart 32: 2015 Global Perfluoroalkoxy (PFA) Estimated Capacities (Metric Tons/Year) by Country/Region ...........98 Chart 33: Perfluoroalkoxy (PFA/MFA) Producers’ Plant- wise Production Capacities ..............................................98 4.1.1.6 Polychlorotrifluoroethylene (PCTFE) ............ 99 Chart 34: 2015 Global Polychlorotrifluoroethylene (PCTFE) Estimated Capacities (Metric Tons/Year) by Company ....99 Chart 35: 2015 Global Polychlorotrifluoroethylene (PCTFE) Estimated Capacities (Metric Tons/Year) by Country/Region ...............................................................99 4.1.1.7 Polyvinyl fluoride (PVF) ................................ 99 4.1.1.8 Ethylene chlorotrifluoroethylene (ECTFE) .... 99 4.2 Key Global Players......................................... 100 3M Company (United States) ........................................ 100 Arkema Group (France) ................................................. 105 Asahi Glass Co Ltd (Japan) ............................................. 108 Daikin Industries Ltd (Japan) ......................................... 112 Dongyue Group Limited (China) .................................... 119 E. I. Du Pont De Nemours and Company (United States) . 121 Gujarat Fluorochemicals Limited (India) ....................... 122 HaloPolymer OJSC (Russia) ........................................... 124 Honeywell International Inc. (United States) ................ 126 Jiangsu Meilan Chemical Co Ltd (China) ........................ 127 Jinhua Yonghe Fluorochemical Co Ltd (China) ............... 128 Kureha Corporation (Japan) .......................................... 129 Shanghai 3F New Material Co Ltd (China) ..................... 131 Solvay SA (Belgium)....................................................... 132 The Chemours Company (United States) ...................... 138 Zhejiang Juhua Co Ltd (China) ....................................... 149 Zhonghao Chenguang Research Institute Chemical Industry (China) ............................................................ 150 5. KEY BUSINESS & PRODUCT TRENDS ................. 151 Arkema and HP in Collaboration ................................... 151 Solvay Showcases Extensive Line of High-Performance Polymers for Electric Vehicle Battery and Battery Packs151 Polymem Develops Production Line for Hollow Fiber Membranes Made from Arkema’s Kynar® .................... 152 Gore Aerospace Cables Address the Need for Reliable High-Speed Data Transmission ...................................... 152 DuPont Tedlar Films to be Distributed by American Durafilm® ...................................................................... 152 Arkema Expands Scope of Use for Patent-Pending Kynar® Foam Extrusion ............................................................. 153 Arkema and PPG Celebrate Half a Century of Association 153 Kureha Takes over Kureha Battery Materials Japan ...... 153 Arkema’s High Performing Kynar Flex® Grade for the Wire and Cable Sector Launched ........................................... 154 AGC Introduces Fluon® LM-ETFE LH-8000 for New Applications .................................................................. 154 Arkema Launches Additional PVDF Polymer Process Aids 154 3M™ Dyneon™ Compound NST 1111R Launched ......... 155 The Chemours Company Spun Off from DuPont ........... 155 Solvay to Commence PVDF Production at its Chinese Plant by 2017 ......................................................................... 155 Solvay Specialty Polymers’ ECTEF Resin Films Used in Amcor’s Flexible Solar Front Sheets .............................. 155 EU Intends to Ban PFOA ................................................ 156 AGC Chemicals Enters Brazilian Fluoropolymer Market 156 Shanghai 3F New Materials’ PTFE Capacity Expanded .. 156 AGC FluoroCompounds Group Inaugurates Pilot Plant . 156 Arkema’s New Grade of Kynar® PVDF Resin Launched . 157 DuPont Fluoropolymer Solutions Consolidates Chinese Operations .................................................................... 157 Solvay Launches Two New ECTFE Film Grades for PV Front Sheet Applications ........................................................ 157 3M Introduces 3M™ Dyneon™ PTFE Dispersion TF 5035GZ without APEO and APFO ............................................... 158 Kureha Completes Construction of PVDF Plant in China 158 Zhejiang Juhua Co Ltd to Build PVDF Facility ................. 158 Arkema Expands Kynar® PVDF Portfolio with New Grade for Drinking Water Systems .......................................... 158 Honeywell’s Brazilian Operations See Growth .............. 159 Solvay Introduces Novel Grades of Halar® ECTFE Film .. 159 Korean Researchers Develop Novel Technology for Manufacturing VDF ....................................................... 159 Arkema Showcases Kynar® Aquatec® CRX Latex ........... 160 DuPont™ Fluoropolymer Solutions Expands Melt- Processable Fluoroplastic Resin Capacity ...................... 160 UL Plastics Component Database Certifies DuPont Fluoroplastic’s ECCtreme™ ECA 3000 as Having the Highest Temperature Rating ......................................... 160 New FEP Fluoroplastic Resin Launched by DuPont Chemicals & Fluoroproducts ......................................... 161 Arkema’s Kynar® PVDF Granted Approval for Long-Term UV Resistance ............................................................... 161 Solvay and Shanghai 3F in Collaboration ....................... 161 Arkema Introduces New PVDF Film for Photovoltaic Panel Back Sheets ................................................................... 162 Solvay Specialty Polymers’ Recycled Grades of PVDF Resin Launched ...................................................................... 162 New PTFE Compounding Technology from Dyneon ...... 162 Solvay Celebrates 15 Years of Solef® 60512 PVDF Resin in Flexible Risers and Flowlines for Oil & Gas ................... 162 HaloPolymer’s Fluoroplastics Meet European Food Industry’s Regulations .................................................. 163 Shandong Dongyue Polymer Material Co Ltd Acquires Shandong Huaxia Shenzhou New material Co Ltd ........ 163 3M Expands Polymer Facility ........................................ 163 Arkema Reintroduces Kynar® 460 PVDF Resins ............ 164 Solvay Increases SOLEF® Production Capacity .............. 164 HaloPolymer Joins SPI ................................................... 164 Arkema Expands PVDF Production at Changshu ........... 164 PVDF Fluoropolymers Capacity at Arkema’s French Facility Increased ...................................................................... 165 DuPont™ Teflon® Fluoropolymer Foam Resin FFR 880 Launched ...................................................................... 165 3M Expands German Fluoropolymer Operations .......... 165 Dyneon Receives Funds from German Federal Environment Ministry ................................................... 166 Solvay Introduces Second Generation Solef® 80 000 Series e-PVDF Foam ................................................................ 166 Honeywell PCTFE Films to be Distributed by American Durafilm ....................................................................... 166 Daikin America Expands Fluoropolymer Capacity ......... 167 Saint-Gobain Performance Plastics Expands Manufacturing Operations .................................................................... 167 AGC Expands Production Capacity of Fluon® ETFE Fluorinated Resin .......................................................... 167 Arkema’s Chinese Facility Starts Operations ................. 167 6. GLOBAL MARKET OVERVIEW ........................... 168 Chart 36: Global Fluoropolymers Market Analysis (2012- 2022) in Volume (Metric Tons) and Value (USD Million) .. 168 6.1 Global Fluoropolymers Market Overview by Fluoropolymer Type .............................................. 169 Volume Analysis .................................................... 169 Chart 37: Global Fluoropolymers Market Analysis (2012- 2022) by Fluoropolymer Type – PTFE, FEP, PVDF, ETFE, PFA, PVF, PCTFE and ECTFE in Metric Tons ................... 169 Chart 38: Glance at 2012, 2017 and 2022 Global Fluoropolymers Volume Market Share (%) by Fluoropolymer Type – PTFE, FEP, PVDF, ETFE, PFA, PVF, PCTFE and ECTFE .......................................................... 170 Value Analysis ........................................................ 171 Chart 39: Global Fluoropolymers Market Analysis (2012- 2022) by Fluoropolymer Type – PTFE, FEP, PVDF, ETFE, PFA, PVF, PCTFE and ECTFE in USD Million ................... 171 Chart 40: Glance at 2012, 2017 and 2022 Global Fluoropolymers Value Market Share (%) by Fluoropolymer Type – PTFE, FEP, PVDF, ETFE, PFA, PVF, PCTFE and ECTFE .. 172 6.1.1 Polytetrafluoroethylene (PTFE) ..................... 173 6.1.1.1 Market Overview by Global Region ........... 173 Volume Analysis .................................................... 173 Chart 41: Global Polytetrafluoroethylene (PTFE) Market Analysis (2012-2022) by Geographic Region – North America, Europe, Asia-Pacific and Rest of World in Metric Tons ......... 173 Chart 42: Glance at 2012, 2017 and 2022 Global Polytetrafluoroethylene (PTFE) Volume Market Share (%) by Geographic Region – North America, Europe, Asia- Pacific and Rest of World .............................................. 174 Value Analysis ........................................................ 175 Chart 43: Global Polytetrafluoroethylene (PTFE) Market Analysis (2012-2022) by Geographic Region – North America, Europe, Asia-Pacific and Rest of World in USD Million .......................................................................... 175 Chart 44: Glance at 2012, 2017 and 2022 Global Polytetrafluoroethylene (PTFE) Value Market Share (%) by Geographic Region – North America, Europe, Asia-Pacific and Rest of World ......................................................... 176 6.1.1.2 Market Overview by End-use Sector .......... 177 Volume Analysis .................................................... 177 Chart 45: Global Polytetrafluoroethylene (PTFE) Market Analysis (2012-2022) by End-use Sector – Chemical Processing, Electrical & Electronics, Mechanical/Industrial, Automotive & Transportation, Building &Construction and Others in Metric Tons ................................................... 177 Click here to buy the report Page 4
Global Fluoropolymers Market – Products, Technologies and Applications June 2016 |588 Pages | 408 Charts | Price $5760 Chart 46: Glance at 2012, 2017 and 2022 Global Polytetrafluoroethylene (PTFE) Volume Market Share (%) by End-use Sector – Chemical Processing, Electrical & Electronics, Mechanical/Industrial, Automotive & Transportation, Building & Construction and Others ..... 178 Value Analysis ........................................................ 179 Chart 47: Global Polytetrafluoroethylene (PTFE) Market Analysis (2012-2022) by End-use Sector – Chemical Processing, Electrical & Electronics, Mechanical/Industrial, Automotive & Transportation, Building & Construction and Others in USD Million ............................................. 179 Chart 48: Glance at 2012, 2017 and 2022 Global Polytetrafluoroethylene (PTFE) Value Market Share (%) by End-use Sector – Chemical Processing, Electrical & Electronics, Mechanical/Industrial, Automotive & Transportation, Building & Construction and Others ..... 180 6.1.2 Fluorinated Ethylene Propylene (FEP) ........... 181 6.1.2.1 Market Overview by Global Region ........... 181 Volume Analysis ..................................................... 181 Chart 49: Global Fluorinated Ethylene Propylene (FEP) Market Analysis (2012-2022) by Geographic Region – North America, Europe, Asia-Pacific and Rest of World in Metric Tons ................................................................... 181 Chart 50: Glance at 2012, 2017 and 2022 Global Fluorinated Ethylene Propylene (FEP) Volume Market Share (%) by Geographic Region – North America, Europe, Asia-Pacific and Rest of World ....................................... 182 Value Analysis ........................................................ 183 Chart 51: Global Fluorinated Ethylene Propylene (FEP) Market Analysis (2012-2022) by Geographic Region – North America, Europe, Asia-Pacific and Rest of World in USD Million ................................................................... 183 Chart 52: Glance at 2012, 2017 and 2022 Global Fluorinated Ethylene Propylene (FEP) Value Market Share (%) by Geographic Region – North America, Europe, Asia- Pacific and Rest of World............................................... 184 6.1.2.2 Market Overview by End-use Sector .......... 185 Volume Analysis ..................................................... 185 Chart 53: Global Fluorinated Ethylene Propylene (FEP) Market Analysis (2012-2022) by End-use Sector – Chemical Processing, Electrical & Electronics, Mechanical/Industrial, Automotive & Transportation and Others in Metric Tons ............................ 185 Chart 54: Glance at 2012, 2017 and 2022 Global Fluorinated Ethylene Propylene (FEP) Volume Market Share (%) by End-use Sector – Chemical Processing, Electrical & Electronics, Mechanical/Industrial, Automotive & Transportation and Others ..................... 186 Value Analysis ........................................................ 187 Chart 55: Global Fluorinated Ethylene Propylene (FEP) Market Analysis (2012-2022) by End-use Sector – Chemical Processing, Electrical & Electronics, Mechanical/Industrial, Automotive & Transportation and Others in USD Million ............................ 187 Chart 56: Glance at 2012, 2017 and 2022 Global Fluorinated Ethylene Propylene (FEP) Value Market Share (%) by End-use Sector – Chemical Processing, Electrical & Electronics, Mechanical/Industrial, Automotive & Transportation and Others ............................................ 188 6.1.3 Polyvinylidene Fluoride (PVDF) ..................... 189 6.1.3.1 Market Overview by Global Region ........... 189 Volume Analysis ..................................................... 189 Chart 57: Global Polyvinylidene Fluoride (PVDF) Market Analysis (2012-2022) by Geographic Region – North America, Europe, Asia-Pacific and Rest of World in Metric Tons............................................................................... 189 Chart 58: Glance at 2012, 2017 and 2022 Global Polyvinylidene Fluoride (PVDF) Volume Market Share (%) by Geographic Region – North America, Europe, Asia- Pacific and Rest of World............................................... 190 Value Analysis ........................................................ 191 Chart 59: Global Polyvinylidene Fluoride (PVDF) Market Analysis (2012-2022) by Geographic Region – North America, Europe, Asia-Pacific and Rest of World in USD Million ........................................................................... 191 Chart 60: Glance at 2012, 2017 and 2022 Global Polyvinylidene Fluoride (PVDF) Value Market Share (%) by Geographic Region – North America, Europe, Asia-Pacific and Rest of World.......................................................... 192 6.1.3.2 Market Overview by End-use Sector .......... 193 Volume Analysis..................................................... 193 Chart 61: Global Polyvinylidene Fluoride (PVDF) Market Analysis (2012-2022) by End-use Sector – Chemical Processing, Electrical & Electronics, Mechanical/Industrial, Automotive & Transportation, Building & Construction and Others in Metric Tons ............................................ 193 Chart 62: Glance at 2012, 2017 and 2022 Global Polyvinylidene Fluoride (PVDF) Volume Market Share (%) by End-use Sector – Chemical Processing, Electrical & Electronics, Mechanical/Industrial, Automotive & Transportation, Building & Construction and Others .... 194 Value Analysis ........................................................ 195 Chart 63: Global Polyvinylidene Fluoride (PVDF) Market Analysis (2012-2022) by End-use Sector – Chemical Processing, Electrical & Electronics, Mechanical/Industrial, Automotive & Transportation, Building & Construction and Others in USD Million ............................................. 195 Chart 64: Glance at 2012, 2017 and 2022 Global Polyvinylidene Fluoride (PVDF) Value Market Share (%) by End-use Sector – Chemical Processing, Electrical & Electronics, Mechanical/Industrial, Automotive & Transportation, Building & Construction and Others .... 196 6.1.4 Ethylene Tetrafluoroethylene (ETFE) ............ 197 6.1.4.1 Market Overview by Global Region ........... 197 Volume Analysis..................................................... 197 Chart 65: Global Ethylene Tetrafluoroethylene (ETFE) Market Analysis (2012-2022) by Geographic Region – North America, Europe, Asia-Pacific and Rest of World in Metric Tons ................................................................... 197 Chart 66: Glance at 2012, 2017 and 2022 Global Ethylene Tetrafluoroethylene (ETFE) Volume Market Share (%) by Geographic Region – North America, Europe, Asia-Pacific and Rest of World ......................................................... 198 Value Analysis ........................................................ 199 Chart 67: Global Ethylene Tetrafluoroethylene (ETFE) Market Analysis (2012-2022) by Geographic Region – North America, Europe, Asia-Pacific and Rest of World in USD Million ................................................................... 199 Chart 68: Glance at 2012, 2017 and 2022 Global Ethylene Tetrafluoroethylene (ETFE) Value Market Share (%) by Geographic Region – North America, Europe, Asia-Pacific and Rest of World ......................................................... 200 6.1.4.2 Market Overview by End-use Sector .......... 201 Volume Analysis..................................................... 201 Chart 69: Global Ethylene Tetrafluoroethylene (ETFE) Market Analysis (2012-2022) by End-use Sector – Chemical Processing, Electrical & Electronics, Mechanical/Industrial, Automotive & Transportation, Building & Construction and Others in Metric Tons ............................................ 201 Chart 70: Glance at 2012, 2017 and 2022 Global Ethylene Tetrafluoroethylene (ETFE) Volume Market Share (%) by End-use Sector – Chemical Processing, Electrical & Electronics, Mechanical/Industrial, Automotive & Transportation, Building & Construction and Others .... 202 Value Analysis ........................................................ 203 Chart 71: Global Ethylene Tetrafluoroethylene (ETFE) Market Analysis (2012-2022) by End-use Sector – Chemical Processing, Electrical & Electronics, Mechanical/Industrial, Automotive & Transportation, Building & Construction and Others in USD Million ............................................. 203 Chart 72: Glance at 2012, 2017 and 2022 Global Ethylene Tetrafluoroethylene (ETFE) Value Market Share (%) by End-use Sector – Chemical Processing, Electrical & Electronics, Mechanical/Industrial, Automotive & Transportation, Building & Construction and Others .... 204 6.1.5 Perfluoroalkoxy (PFA) ................................... 205 6.1.5.1 Market Overview by Global Region ........... 205 Volume Analysis..................................................... 205 Chart 73: Global Perfluoroalkoxy (PFA) Market Analysis (2012-2022) by Geographic Region – North America, Europe, Asia-Pacific and Rest of World in Metric Tons .. 205 Chart 74: Glance at 2012, 2017 and 2022 Global Perfluoroalkoxy (PFA) Volume Market Share (%) by Geographic Region – North America, Europe, Asia-Pacific and Rest of World ......................................................... 206 Value Analysis ........................................................ 207 Chart 75: Global Perfluoroalkoxy (PFA) Market Analysis (2012-2022) by Geographic Region – North America, Europe, Asia-Pacific and Rest of World in USD Million.. 207 Chart 76: Glance at 2012, 2017 and 2022 Global Perfluoroalkoxy (PFA) Value Market Share (%) by Geographic Region – North America, Europe, Asia-Pacific and Rest of World ......................................................... 208 6.1.5.2 Market Overview by End-use Sector .......... 209 Volume Analysis .................................................... 209 Chart 77: Global Perfluoroalkoxy (PFA) Market Analysis (2012-2022) by End-use Sector – Chemical Processing, Electrical & Electronics, Mechanical/Industrial, Automotive & Transportation and Others in Metric Tons .................... 209 Chart 78: Glance at 2012, 2017 and 2022 Global Perfluoroalkoxy (PFA) Volume Market Share (%) by End- use Sector – Chemical Processing, Electrical & Electronics, Mechanical/Industrial, Automotive & Transportation and Others .......................................................................... 210 Value Analysis ........................................................ 211 Chart 79: Global Perfluoroalkoxy (PFA) Market Analysis (2012-2022) by End-use Sector – Chemical Processing, Electrical & Electronics, Mechanical/Industrial, Automotive & Transportation and Others in USD Million .................... 211 Chart 80: Glance at 2012, 2017 and 2022 Global Perfluoroalkoxy (PFA) Value Market Share (%) by End-use Sector – Chemical Processing, Electrical & Electronics, Mechanical/Industrial, Automotive & Transportation and Others .......................................................................... 212 6.1.6 Polyvinyl Fluoride (PVF) ................................ 213 6.1.6.1 Market Overview by Global Region ........... 213 Volume Analysis .................................................... 213 Chart 81: Global Polyvinyl Fluoride (PVF) Market Analysis (2012-2022) by Geographic Region – North America and Europe in Metric Tons .................................................. 213 Chart 82: Glance at 2012, 2017 and 2022 Global Polyvinyl Fluoride (PVF) Volume Market Share (%) by Geographic Region – North America and Europe ............................ 214 Value Analysis ........................................................ 215 Chart 83: Global Polyvinyl Fluoride (PVF) Market Analysis (2012-2022) by Geographic Region – North America and Europe in USD Million ................................................... 215 Chart 84: Glance at 2012, 2017 and 2022 Global Polyvinyl Fluoride (PVF) Value Market Share (%) by Geographic Region – North America and Europe ............................ 216 6.1.6.2 Market Overview by End-use Sector .......... 217 Volume Analysis .................................................... 217 Chart 85: Global Polyvinyl Fluoride (PVF) Market Analysis (2012-2022) by End-use Sector – Electrical & Electronics, Mechanical/Industrial, Automotive & Transportation, Building & Construction and Others in Metric Tons ...... 217 Chart 86: Glance at 2012, 2017 and 2022 Global Polyvinyl Fluoride (PVF) Volume Market Share (%) by End-use Sector – Electrical & Electronics, Mechanical/Industrial, Automotive & Transportation, Building & Construction and Others .................................................................... 218 Value Analysis ........................................................ 219 Chart 87: Global Polyvinyl Fluoride (PVF) Market Analysis (2012-2022) by End-use Sector – Electrical & Electronics, Mechanical/Industrial, Automotive & Transportation, Building & Construction and Others in USD Million ...... 219 Chart 88: Glance at 2012, 2017 and 2022 Global Polyvinyl Fluoride (PVF) Value Market Share (%) by End-use Sector – Electrical & Electronics, Mechanical/Industrial, Automotive & Transportation, Building & Construction and Others .................................................................... 220 6.1.7 Polychlorotrifluoroethylene (PCTFE) ............. 221 6.1.7.1 Market Overview by Global Region ........... 221 Volume Analysis .................................................... 221 Chart 89: Global Polychlorotrifluoroethylene (PCTFE) Market Analysis (2012-2022) by Geographic Region – North America, Europe and Asia-Pacific in Metric Tons 221 Chart 90: Glance at 2012, 2017 and 2022 Global Polychlorotrifluoroethylene (PCTFE) Volume Market Share (%) by Geographic Region – North America, Europe and Asia-Pacific ................................................................... 222 Click here to buy the report Page 5
Global Fluoropolymers Market – Products, Technologies and Applications June 2016 |588 Pages | 408 Charts | Price $5760 Chart 122: Glance at 2012, 2017 and 2022 Global Volume Market Share (%) for Fluoropolymers in Electrical & Electronics Sector by Fluoropolymer Type – PTFE, FEP, PVDF, ETFE, PFA, PVF, PCTFE and ECTFE ....................... 254 Value Analysis ........................................................ 255 Chart 123: Global Market for Fluoropolymers in Electrical & Electronics Sector (2012-2022) by Fluoropolymer Type – PTFE, FEP, PVDF, ETFE, PFA, PVF, PCTFE and ECTFE in USD Million .... 255 Chart 124: Glance at 2012, 2017 and 2022 Global Value Market Share (%) for Fluoropolymers in Electrical & Electronics Sector by Fluoropolymer Type – PTFE, FEP, PVDF, ETFE, PFA, PVF, PCTFE and ECTFE ....................... 256 6.2.3 Mechanical/Industrial Sector ........................ 257 6.2.3.1 Market Overview by Global Region ........... 257 Volume Analysis .................................................... 257 Chart 125: Global Market for Fluoropolymers in Mechanical/Industrial Sector (2012-2022) by Geographic Region – North America, Europe, Asia-Pacific and Rest of World in Metric Tons .................................................... 257 Chart 126: Glance at 2012, 2017 and 2022 Global Volume Market Share (%) for Fluoropolymers in Mechanical/Industrial Sector by Geographic Region – North America, Europe, Asia-Pacific and Rest of World 258 Value Analysis ........................................................ 259 Chart 127: Global Market for Fluoropolymers in Mechanical/Industrial Sector (2012-2022) by Geographic Region – North America, Europe, Asia-Pacific and Rest of World in USD Million .................................................... 259 Chart 128: Glance at 2012, 2017 and 2022 Global Value Market Share (%) for Fluoropolymers in Mechanical/Industrial Sector by Geographic Region – North America, Europe, Asia-Pacific and Rest of World 260 6.2.3.2 Market Overview by Fluoropolymer Type . 261 Volume Analysis .................................................... 261 Chart 129: Global Market for Fluoropolymers in Mechanical/Industrial Sector (2012-2022) by Fluoropolymer Type – PTFE, FEP, PVDF, ETFE, PFA, PVF, PCTFE and ECTFE in Metric Tons ................................... 261 Chart 130: Glance at 2012, 2017 and 2022 Global Volume Market Share (%) for Fluoropolymers in Mechanical/Industrial Sector by Fluoropolymer Type – PTFE, FEP, PVDF, ETFE, PFA, PVF, PCTFE and ECTFE ...... 262 Value Analysis ........................................................ 263 Chart 131: Global Market for Fluoropolymers in Mechanical/Industrial Sector (2012-2022) by Fluoropolymer Type – PTFE, FEP, PVDF, ETFE, PFA, PVF, PCTFE and ECTFE in USD Million ................................... 263 Chart 132: Glance at 2012, 2017 and 2022 Global Value Market Share (%) for Fluoropolymers in Mechanical/Industrial Sector by Fluoropolymer Type – PTFE, FEP, PVDF, ETFE, PFA, PVF, PCTFE and ECTFE ...... 264 6.2.4 Automotive & Transportation Sector ............ 265 6.2.4.1 Market Overview by Global Region ........... 265 Volume Analysis .................................................... 265 Chart 133: Global Market for Fluoropolymers in Automotive & Transportation Sector (2012-2022) by Geographic Region – North America, Europe, Asia-Pacific and Rest of World in Metric Tons ................................. 265 Chart 134: Glance at 2012, 2017 and 2022 Global Volume Market Share (%) for Fluoropolymers in Automotive & Transportation Sector by Geographic Region – North America, Europe, Asia-Pacific and Rest of World .......... 266 Value Analysis ........................................................ 267 Chart 135: Global Market for Fluoropolymers in Automotive & Transportation Sector (2012-2022) by Geographic Region – North America, Europe, Asia-Pacific and Rest of World in USD Million ................................. 267 Chart 136: Glance at 2012, 2017 and 2022 Global Value Market Share (%) for Fluoropolymers in Automotive & Transportation Sector by Geographic Region – North America, Europe, Asia-Pacific and Rest of World .......... 268 6.2.4.2 Market Overview by Fluoropolymer Type . 269 Volume Analysis .................................................... 269 Chart 137: Global Market for Fluoropolymers in Automotive & Transportation Sector (2012-2022) by Fluoropolymer Type – PTFE, FEP, PVDF, ETFE, PFA, PVF and ECTFE in Metric Tons .................................................... 269 Value Analysis ........................................................ 223 Chart 91: Global Polychlorotrifluoroethylene (PCTFE) Market Analysis (2012-2022) by Geographic Region – North America, Europe and Asia-Pacific in USD Million . 223 Chart 92: Glance at 2012, 2017 and 2022 Global Polychlorotrifluoroethylene (PCTFE) Value Market Share (%) by Geographic Region – North America, Europe and Asia-Pacific .................................................................... 224 6.1.7.2 Market Overview by End-use Sector .......... 225 Volume Analysis ..................................................... 225 Chart 93: Global Polychlorotrifluoroethylene (PCTFE) Market Analysis (2012-2022) by End-use Sector – Chemical Processing, Electrical & Electronics, Mechanical/Industrial, Pharma Packing and Others in Metric Tons ................... 225 Chart 94: Glance at 2012, 2017 and 2022 Global Polychlorotrifluoroethylene (PCTFE) Volume Market Share (%) by End-use Sector – Chemical Processing, Electrical & Electronics, Mechanical/Industrial, Pharma Packing and Others ........................................................................... 226 Value Analysis ........................................................ 227 Chart 95: Global Polychlorotrifluoroethylene (PCTFE) Market Analysis (2012-2022) by End-use Sector – Chemical Processing, Electrical & Electronics, Mechanical/Industrial, Pharma Packing and Others in USD Million ................... 227 Chart 96: Glance at 2012, 2017 and 2022 Global Polychlorotrifluoroethylene (PCTFE) Value Market Share (%) by End-use Sector – Chemical Processing, Electrical & Electronics, Mechanical/Industrial, Pharma Packing and Others ........................................................................... 228 6.1.8 Ethylene Chlorotrifluoroethylene (ECTFE) .... 229 6.1.8.1 Market Overview by Global Region ........... 229 Volume Analysis ..................................................... 229 Chart 97: Global Ethylene Chlorotrifluoroethylene (ECTFE) Market Analysis (2012-2022) by Geographic Region – North America, Europe and Asia-Pacific in Metric Tons . 229 Chart 98: Glance at 2012, 2017 and 2022 Global Ethylene Chlorotrifluoroethylene (ECTFE) Volume Market Share (%) by Geographic Region – North America, Europe and Asia- Pacific ............................................................................ 230 Value Analysis ........................................................ 231 Chart 99: Global Ethylene Chlorotrifluoroethylene (ECTFE) Market Analysis (2012-2022) by Geographic Region – North America, Europe and Asia-Pacific in USD Million . 231 Chart 100: Glance at 2012, 2017 and 2022 Global Ethylene Chlorotrifluoroethylene (ECTFE) Value Market Share (%) by Geographic Region – North America, Europe and Asia- Pacific ............................................................................ 232 6.1.8.2 Market Overview by End-use Sector .......... 233 Volume Analysis ..................................................... 233 Chart 101: Global Ethylene Chlorotrifluoroethylene (ECTFE) Market Analysis (2012-2022) by End-use Sector – Chemical Processing, Electrical & Electronics, Mechanical/Industrial, Automotive & Transportation, Building & Construction and Others in Metric Tons ....... 233 Chart 102: Glance at 2012, 2017 and 2022 Global Ethylene Chlorotrifluoroethylene (ECTFE) Volume Market Share (%) by End-use Sector – Chemical Processing, Electrical & Electronics, Mechanical/Industrial, Automotive & Transportation, Building & Construction and Others ..... 234 Value Analysis ........................................................ 235 Chart 103: Global Ethylene Chlorotrifluoroethylene (ECTFE) Market Analysis (2012-2022) by End-use Sector – Chemical Processing, Electrical & Electronics, Mechanical/Industrial, Automotive & Transportation, Building & Construction and Others in USD Million ....... 235 Chart 104: Glance at 2012, 2017 and 2022 Global Ethylene Chlorotrifluoroethylene (ECTFE) Value Market Share (%) by End-use Sector – Chemical Processing, Electrical & Electronics, Mechanical/Industrial, Automotive & Transportation, Building & Construction and Others ..... 236 6.2 Global Fluoropolymers Market Overview by End- use Sector .............................................................. 237 Volume Analysis ..................................................... 237 Chart 105: Global Fluoropolymers Market Analysis (2012-2022) by End-use Sector – Chemical Processing, Electrical & Electronics, Mechanical/Industrial, Automotive & Transportation, Building & Construction and Others in Metric Tons ..................................... 237 Chart 106: Glance at 2012, 2017 and 2022 Global Fluoropolymers Volume Market Share (%) by End-use Sector – Chemical Processing, Electrical & Electronics, Mechanical/Industrial, Automotive & Transportation, Building & Construction and Others .............................. 238 Value Analysis ........................................................ 239 Chart 107: Global Fluoropolymers Market Analysis (2012-2022) by End-use Sector – Chemical Processing, Electrical & Electronics, Mechanical/Industrial, Automotive & Transportation, Building & Construction and Others in USD Million ..................................... 239 Chart 108: Glance at 2012, 2017 and 2022 Global Fluoropolymers Value Market Share (%) by End-use Sector – Chemical Processing, Electrical & Electronics, Mechanical/Industrial, Automotive & Transportation, Building & Construction and Others .............................. 240 6.2.1 Chemical Processing Sector .......................... 241 6.2.1.1 Market Overview by Global Region ........... 241 Volume Analysis..................................................... 241 Chart 109: Global Market for Fluoropolymers in Chemical Processing Sector (2012-2022) by Geographic Region – North America, Europe, Asia-Pacific and Rest of World in Metric Tons ................................................................... 241 Chart 110: Glance at 2012, 2017 and 2022 Global Volume Market Share (%) for Fluoropolymers in Chemical Processing Sector by Geographic Region – North America, Europe, Asia-Pacific and Rest of World ......................... 242 Value Analysis ........................................................ 243 Chart 111: Global Market for Fluoropolymers in Chemical Processing Sector (2012-2022) by Geographic Region – North America, Europe, Asia-Pacific and Rest of World in USD Million ................................................................... 243 Chart 112: Glance at 2012, 2017 and 2022 Global Value Market Share (%) for Fluoropolymers in Chemical Processing Sector by Geographic Region – North America, Europe, Asia-Pacific and Rest of World ......................... 244 6.2.1.2 Market Overview by Fluoropolymer Type . 245 Volume Analysis..................................................... 245 Chart 113: Global Market for Fluoropolymers in Chemical Processing Sector (2012-2022) by Fluoropolymer Type – PTFE, FEP, PVDF, ETFE, PFA, PCTFE and ECTFE in Metric Tons ....... 245 Chart 114: Glance at 2012, 2017 and 2022 Global Volume Market Share (%) for Fluoropolymers in Chemical Processing Sector by Fluoropolymer Type – PTFE, FEP, PVDF, ETFE, PFA, PCTFE and ECTFE ............................... 246 Value Analysis ........................................................ 247 Chart 115: Global Market for Fluoropolymers in Chemical Processing Sector (2012-2022) by Fluoropolymer Type – PTFE, FEP, PVDF, ETFE, PFA, PCTFE and ECTFE in USD Million ....... 247 Chart 116: Glance at 2012, 2017 and 2022 Global Value Market Share (%) for Fluoropolymers in Chemical Processing Sector by Fluoropolymer Type – PTFE, FEP, PVDF, ETFE, PFA, PCTFE and ECTFE ............................... 248 6.2.2 Electrical & Electronics Sector ...................... 249 6.2.2.1 Market Overview by Global Region ........... 249 Volume Analysis..................................................... 249 Chart 117: Global Market for Fluoropolymers in Electrical & Electronics Sector (2012-2022) by Geographic Region – North America, Europe, Asia-Pacific and Rest of World in Metric Tons ................................................................... 249 Chart 118: Glance at 2012, 2017 and 2022 Global Volume Market Share (%) for Fluoropolymers in Electrical & Electronics Sector by Geographic Region – North America, Europe, Asia-Pacific and Rest of World ......................... 250 Value Analysis ........................................................ 251 Chart 119: Global Market for Fluoropolymers in Electrical & Electronics Sector (2012-2022) by Geographic Region – North America, Europe, Asia-Pacific and Rest of World in USD Million ................................................................... 251 Chart 120: Glance at 2012, 2017 and 2022 Global Value Market Share (%) for Fluoropolymers in Electrical & Electronics Sector by Geographic Region – North America, Europe, Asia-Pacific and Rest of World ......................... 252 6.2.2.2 Market Overview by Fluoropolymer Type . 253 Volume Analysis..................................................... 253 Chart 121: Global Market for Fluoropolymers in Electrical & Electronics Sector (2012-2022) by Fluoropolymer Type – PTFE, FEP, PVDF, ETFE, PFA, PVF, PCTFE and ECTFE in Metric Tons ... 253 Click here to buy the report Page 6
Global Fluoropolymers Market – Products, Technologies and Applications June 2016 |588 Pages | 408 Charts | Price $5760 Chart 138: Glance at 2012, 2017 and 2022 Global Volume Market Share (%) for Fluoropolymers in Automotive & Transportation Sector by Fluoropolymer Type – PTFE, FEP, PVDF, ETFE, PFA, PVF and ECTFE ................................... 270 Value Analysis ........................................................ 271 Chart 139: Global Market for Fluoropolymers in Automotive & Transportation Sector (2012-2022) by Fluoropolymer Type – PTFE, FEP, PVDF, ETFE, PFA, PVF and ECTFE in USD Million ..................................................... 271 Chart 140: Glance at 2012, 2017 and 2022 Global Value Market Share (%) for Fluoropolymers in Automotive & Transportation Sector by Fluoropolymer Type – PTFE, FEP, PVDF, ETFE, PFA, PVF and ECTFE ................................... 272 6.2.5 Building & Construction Sector ..................... 273 6.2.5.1 Market Overview by Global Region ........... 273 Volume Analysis ..................................................... 273 Chart 141: Global Market for Fluoropolymers in Building & Construction Sector (2012-2022) by Geographic Region – North America, Europe, Asia-Pacific and Rest of World in Metric Tons ................................................................... 273 Chart 142: Glance at 2012, 2017 and 2022 Global Volume Market Share (%) for Fluoropolymers in Building & Construction Sector by Geographic Region – North America, Europe, Asia-Pacific and Rest of World ........... 274 Value Analysis ........................................................ 275 Chart 143: Global Market for Fluoropolymers in Building & Construction Sector (2012-2022) by Geographic Region – North America, Europe, Asia-Pacific and Rest of World in USD Million ................................................................... 275 Chart 144: Glance at 2012, 2017 and 2022 Global Value Market Share (%) for Fluoropolymers in Building & Construction Sector by Geographic Region – North America, Europe, Asia-Pacific and Rest of World ........... 276 6.2.5.2 Market Overview by Fluoropolymer Type . 277 Volume Analysis ..................................................... 277 Chart 145: Global Market for Fluoropolymers in Building & Construction Sector (2012-2022) by Fluoropolymer Type – PTFE, PVDF, ETFE, PVF and ECTFE in Metric Tons .......... 277 Chart 146: Glance at 2012, 2017 and 2022 Global Volume Market Share (%) for Fluoropolymers in Building & Construction Sector by Fluoropolymer Type – PTFE, PVDF, ETFE, PVF and ECTFE ..................................................... 278 Value Analysis ........................................................ 279 Chart 147: Global Market for Fluoropolymers in Building & Construction Sector (2012-2022) by Fluoropolymer Type – PTFE, PVDF, ETFE, PVF and ECTFE in USD Million .......... 279 Chart 148: Glance at 2012, 2017 and 2022 Global Value Market Share (%) for Fluoropolymers in Building & Construction Sector by Fluoropolymer Type – PTFE, PVDF, ETFE, PVF and ECTFE ..................................................... 280 6.2.6 Other End-use Sectors .................................. 281 6.2.6.1 Market Overview by Global Region ........... 281 Volume Analysis ..................................................... 281 Chart 149: Global Market for Fluoropolymers in Other Sectors (2012-2022) by Geographic Region – North America, Europe, Asia-Pacific and Rest of World in Metric Tons ..... 281 Chart 150: Glance at 2012, 2017 and 2022 Global Volume Market Share (%) for Fluoropolymers in Other Sectors by Geographic Region – North America, Europe, Asia-Pacific and Rest of World.......................................................... 282 Value Analysis ........................................................ 283 Chart 151: Global Market for Fluoropolymers in Other Sectors (2012-2022) by Geographic Region – North America, Europe, Asia-Pacific and Rest of World in USD Million ....................... 283 Chart 152: Glance at 2012, 2017 and 2022 Global Value Market Share (%) for Fluoropolymers in Other Sectors by Geographic Region – North America, Europe, Asia-Pacific and Rest of World.......................................................... 284 6.2.6.2 Market Overview by Fluoropolymer Type . 285 Volume Analysis ..................................................... 285 Chart 153: Global Market for Fluoropolymers in Other Sectors (2012-2022) by Fluoropolymer Type – PTFE, FEP, PVDF, ETFE, PFA, PVF, PCTFE and ECTFE in Metric Tons 285 Chart 154: Glance at 2012, 2017 and 2022 Global Volume Market Share (%) for Fluoropolymers in Other Sectors by Fluoropolymer Type – PTFE, FEP, PVDF, ETFE, PFA, PVF, PCTFE and ECTFE ........................................................... 286 Value Analysis ........................................................ 287 Chart 155: Global Market for Fluoropolymers in Other Sectors (2012-2022) by Fluoropolymer Type – PTFE, FEP, PVDF, ETFE, PFA, PVF, PCTFE and ECTFE in USD Million 287 Chart 156: Glance at 2012, 2017 and 2022 Global Value Market Share (%) for Fluoropolymers in Other Sectors by Fluoropolymer Type – PTFE, FEP, PVDF, ETFE, PFA, PVF, PCTFE and ECTFE ........................................................... 288 Value Analysis ........................................................ 304 Chart 172: North American Fluoropolymers Market Analysis (2012-2022) by End-use Sector – Chemical Processing, Electrical & Electronics, Mechanical/Industrial, Automotive & Transportation, Building & Construction and Others in USD Million ............................................ 304 Chart 173: Glance at 2012, 2017 and 2022 North American Fluoropolymers Value Market Share (%) by End-use Sector – Chemical Processing, Electrical & Electronics, Mechanical/Industrial, Automotive & Transportation, Building & Construction and Others .................................. 305 1.3.1 Fluoropolymers Type Market Overview by End- use Sector .............................................................. 306 1.3.1.1 Polytetrafluoroethylene (PTFE) .................. 306 Chart 174: North American Polytetrafluoroethylene (PTFE) Market Analysis (2012, 2016 and 2022) by End-use Sector – Chemical Processing, Electrical & Electronics, Mechanical/Industrial, Automotive & Transportation, Building & Construction and Others in Metric Tons ......... 306 Chart 175: North American Polytetrafluoroethylene (PTFE) Market Analysis (2012, 2016 and 2022) by End-use Sector – Chemical Processing, Electrical & Electronics, Mechanical/Industrial, Automotive & Transportation, Building & Construction and Others in USD Million .......... 307 1.3.1.2 Fluorinated Ethylene Propylene (FEP) ....... 308 Chart 176: North American Fluorinated Ethylene Propylene (FEP) Market Analysis (2012, 2016 and 2022) by End-use Sector – Chemical Processing, Electrical & Electronics, Mechanical/Industrial, Automotive & Transportation and Others in Metric Tons .................... 308 Chart 177: North American Fluorinated Ethylene Propylene (FEP) Market Analysis (2012, 2016 and 2022) by End-use Sector – Chemical Processing, Electrical & Electronics, Mechanical/Industrial, Automotive & Transportation and Others in USD Million .................... 309 1.3.1.3 Polyvinylidene Fluoride (PVDF) .................. 310 Chart 178: North American Polyvinylidene Fluoride (PVDF) Market Analysis (2012, 2016 and 2022) by End-use Sector – Chemical Processing, Electrical & Electronics, Mechanical/Industrial, Automotive & Transportation, Building & Construction and Others in Metric Tons ......... 310 Chart 179: North American Polyvinylidene Fluoride (PVDF) Market Analysis (2012, 2016 and 2022) by End-use Sector – Chemical Processing, Electrical & Electronics, Mechanical/Industrial, Automotive & Transportation, Building & Construction and Others in USD Million .......... 311 1.3.1.4 Ethylene Tetrafluoroethylene (ETFE) ......... 312 Chart 180: North American Ethylene Tetrafluoroethylene (ETFE) Market Analysis (2012, 2016 and 2022) by End-use Sector – Chemical Processing, Electrical & Electronics, Mechanical/Industrial, Automotive & Transportation, Building & Construction and Others in Metric Tons ...... 312 Chart 181: North American Ethylene Tetrafluoroethylene (ETFE) Market Analysis (2012, 2016 and 2022) by End-use Sector – Chemical Processing, Electrical & Electronics, Mechanical/Industrial, Automotive & Transportation, Building & Construction and Others in USD Million ...... 313 1.3.1.5 Perfluoroalkoxy (PFA) ................................ 314 Chart 182: North American Perfluoroalkoxy (PFA) Market Analysis (2012, 2016 and 2022) by End-use Sector – Chemical Processing, Electrical & Electronics, Mechanical/Industrial, Automotive & Transportation and Others in Metric Tons ................................................... 314 Chart 183: North American Perfluoroalkoxy (PFA) Market Analysis (2012, 2016 and 2022) by End-use Sector – Chemical Processing, Electrical & Electronics, Mechanical/Industrial, Automotive & Transportation and Others in USD Million ................................................... 315 1.3.1.6 Polyvinyl Fluoride (PVF) ............................. 316 Chart 184: North American Polyvinyl Fluoride (PVF) Market Analysis (2012, 2016 and 2022) by End-use Sector – Electrical & Electronics, Mechanical/Industrial, Automotive & Transportation, Building & Construction and Others in Metric Tons .................. 316 Chart 185: North American Polyvinyl Fluoride (PVF) Market Analysis (2012, 2016 and 2022) by End-use Sector – Electrical & Electronics, Mechanical/Industrial, Automotive & Transportation, Building & Construction and Others in USD Million ........................................................................ 317 PART B: REGIONAL MARKET PERSPECTIVE .. 289 Global Fluoropolymers Market Overview by Geographic Region.............................................. 289 Volume Analysis..................................................... 289 Chart 157: Global Fluoropolymers Market Analysis (2012- 2022) by Geographic Region – North America, Europe, Asia-Pacific and Rest of World in Metric Tons ............... 289 Chart 158: Glance at 2012, 2017 and 2022 Global Fluoropolymers Volume Market Share (%) by Geographic Region – North America, Europe, Asia-Pacific and Rest of World ............................................................................ 290 Value Analysis ........................................................ 291 Chart 159: Global Fluoropolymers Market Analysis (2012- 2022) by Geographic Region – North America, Europe, Asia-Pacific and Rest of World in USD Million ............... 291 Chart 160: Glance at 2012, 2017 and 2022 Global Fluoropolymers Value Market Share (%) by Geographic Region – North America, Europe, Asia-Pacific and Rest of World ............................................................................ 292 REGIONAL MARKET OVERVIEW ........................... 293 1. NORTH AMERICA ............................................ 293 Chart 161: North American Fluoropolymers Market Analysis (2012-2022) in Volume (Metric Tons) and Value (USD Million) ................................................................. 293 1.1 Market Overview by Geographic Region ......... 294 Volume Analysis..................................................... 294 Chart 162: North American Fluoropolymers Market Analysis (2012-2022) by Region – United States, Canada and Mexico in Metric Tons ............................................ 294 Chart 163: Glance at 2012, 2017 and 2022 North American Fluoropolymers Volume Market Share (%) by Region – United States, Canada and Mexico ............................... 295 Value Analysis ........................................................ 296 Chart 164: North American Fluoropolymers Market Analysis (2012-2022) by Region – United States, Canada and Mexico in USD Million ............................................ 296 Chart 165: Glance at 2012, 2017 and 2022 North American Fluoropolymers Value Market Share (%) by Region – United States, Canada and Mexico ............................... 297 1.2 Market Overview by Fluoropolymer Type ....... 298 Volume Analysis..................................................... 298 Chart 166: North American Fluoropolymers Market Analysis (2012-2022) by Fluoropolymer Type – PTFE, FEP, PVDF, ETFE, PFA, PVF, PCTFE and ECTFE in Metric Tons 298 Chart 167: Glance at 2012, 2017 and 2022 North American Fluoropolymers Volume Market Share (%) by Fluoropolymer Type – PTFE, FEP, PVDF, ETFE, PFA, PVF, PCTFE and ECTFE ........................................................... 299 Value Analysis ........................................................ 300 Chart 168: North American Fluoropolymers Market Analysis (2012-2022) by Fluoropolymer Type – PTFE, FEP, PVDF, ETFE, PFA, PVF, PCTFE and ECTFE in USD Million .............. 300 Chart 169: Glance at 2012, 2017 and 2022 North American Fluoropolymers Value Market Share (%) by Fluoropolymer Type – PTFE, FEP, PVDF, ETFE, PFA, PVF, PCTFE and ECTFE .. 301 1.3 Market Overview by End-use Sector ................ 302 Volume Analysis..................................................... 302 Chart 170: North American Fluoropolymers Market Analysis (2012-2022) by End-use Sector – Chemical Processing, Electrical & Electronics, Mechanical/Industrial, Automotive & Transportation, Building & Construction and Others in Metric Tons ............................................ 302 Chart 171: Glance at 2012, 2017 and 2022 North American Fluoropolymers Volume Market Share (%) by End-use Sector – Chemical Processing, Electrical & Electronics, Mechanical/Industrial, Automotive & Transportation, Building & Construction and Others .............................. 303 Click here to buy the report Page 7
Global Fluoropolymers Market – Products, Technologies and Applications June 2016 |588 Pages | 408 Charts | Price $5760 Chart 216: Glance at 2012, 2017 and 2022 Mexican Fluoropolymers Value Market Share (%) by End-use Sector – Chemical Processing, Electrical & Electronics, Mechanical/Industrial, Automotive & Transportation, Building & Construction and Others ............................. 359 2. EUROPE .......................................................... 360 Chart 217: European Fluoropolymers Market Analysis (2012-2022) in Volume (Metric Tons) and Value (USD Million) ......................................................................... 360 2.1 Market Overview by Geographic Region ......... 361 Volume Analysis .................................................... 361 Chart 218: European Fluoropolymers Market Analysis (2012-2022) by Region – France, Germany, Italy, Russia, The United Kingdom and Rest of Europe in Metric Tons361 Chart 219: Glance at 2012, 2017 and 2022 European Fluoropolymers Volume Market Share (%) by Region – France, Germany, Italy, Russia, The United Kingdom and Rest of Europe .............................................................. 362 Value Analysis ........................................................ 363 Chart 220: European Fluoropolymers Market Analysis (2012-2022) by Region – France, Germany, Italy, Russia, The United Kingdom and Rest of Europe in USD Million 363 Chart 221: Glance at 2012, 2017 and 2022 European Fluoropolymers Value Market Share (%) by Region – France, Germany, Italy, Russia, The United Kingdom and Rest of Europe .............................................................. 364 2.2 Market Overview by Fluoropolymer Type ....... 365 Volume Analysis .................................................... 365 Chart 222: European Fluoropolymers Market Analysis (2012-2022) by Fluoropolymer Type – PTFE, FEP, PVDF, ETFE, PFA, PVF, PCTFE and ECTFE in Metric Tons .......... 365 Chart 223: Glance at 2012, 2017 and 2022 European Fluoropolymers Volume Market Share (%) by Fluoropolymer Type – PTFE, FEP, PVDF, ETFE, PFA, PVF, PCTFE and ECTFE .. 366 Value Analysis ........................................................ 367 Chart 224: European Fluoropolymers Market Analysis (2012-2022) by Fluoropolymer Type – PTFE, FEP, PVDF, ETFE, PFA, PVF, PCTFE and ECTFE in USD Million .......... 367 Chart 225: Glance at 2012, 2017 and 2022 European Fluoropolymers Value Market Share (%) by Fluoropolymer Type – PTFE, FEP, PVDF, ETFE, PFA, PVF, PCTFE and ECTFE .. 368 2.3 Market Overview by End-use Sector ................ 369 Volume Analysis .................................................... 369 Chart 226: European Fluoropolymers Market Analysis (2012-2022) by End-use Sector – Chemical Processing, Electrical & Electronics, Mechanical/Industrial, Automotive & Transportation, Building & Construction and Others in Metric Tons ............................................ 369 Chart 227: Glance at 2012, 2017 and 2022 European Fluoropolymers Volume Market Share (%) by End-use Sector – Chemical Processing, Electrical & Electronics, Mechanical/Industrial, Automotive & Transportation, Building & Construction and Others ............................. 370 Value Analysis ........................................................ 371 Chart 228: European Fluoropolymers Market Analysis (2012-2022) by End-use Sector – Chemical Processing, Electrical & Electronics, Mechanical/Industrial, Automotive & Transportation, Building & Construction and Others in USD Million ............................................ 371 Chart 229: Glance at 2012, 2017 and 2022 European Fluoropolymers Value Market Share (%) by End-use Sector – Chemical Processing, Electrical & Electronics, Mechanical/Industrial, Automotive & Transportation, Building & Construction and Others .................................. 372 2.3.1 Fluoropolymers Type Market Overview by End- use Sector .............................................................. 373 2.3.1.1 Polytetrafluoroethylene (PTFE) .................. 373 Chart 230: European Polytetrafluoroethylene (PTFE) Market Analysis (2012, 2016 and 2022) by End-use Sector – Chemical Processing, Electrical & Electronics, Mechanical/Industrial, Automotive & Transportation, Building & Construction and Others in Metric Tons ......... 373 Chart 231: European Polytetrafluoroethylene (PTFE) Market Analysis (2012, 2016 and 2022) by End-use Sector – Chemical Processing, Electrical & Electronics, Mechanical/Industrial, Automotive & Transportation, Building & Construction and Others in USD Million .......... 374 1.3.1.7 Polychlorotrifluoroethylene (PCTFE) .......... 318 Chart 186: North American Polychlorotrifluoroethylene (PCTFE) Market Analysis (2012, 2016 and 2022) by End-use Sector – Chemical Processing, Electrical & Electronics, Mechanical/Industrial, Pharma Packaging and Others in Metric Tons ................................................................... 318 Chart 187: North American Polychlorotrifluoroethylene (PCTFE) Market Analysis (2012, 2016 and 2022) by End-use Sector – Chemical Processing, Electrical & Electronics, Mechanical/Industrial, Pharma Packaging and Others in USD Million ................................................................... 319 1.3.1.8 Ethylene Chlorotrifluoroethylene (ECTFE) . 320 Chart 188: North American Ethylene Chlorotrifluoroethylene (ECTFE) Market Analysis (2012, 2016 and 2022) by End-use Sector – Chemical Processing, Electrical & Electronics, Mechanical/Industrial, Automotive & Transportation, Building & Construction and Others in Metric Tons ............................................. 320 Chart 189: North American Ethylene Chlorotrifluoroethylene (ECTFE) Market Analysis (2012, 2016 and 2022) by End-use Sector – Chemical Processing, Electrical & Electronics, Mechanical/Industrial, Automotive & Transportation, Building & Construction and Others in USD Million ............................................. 321 1.4 Major Market Players ...................................... 322 3M Company (United States) ........................................ 322 Arkema Inc (United States) ............................................ 324 Daikin America, Inc. ....................................................... 326 Honeywell International Inc. (United States) ................. 327 Solvay Specialty Polymers USA, LLC (United States) ...... 328 The Chemours Company (United States) ....................... 330 1.5 North American Fluoropolymers Market Overview by Country ............................................................. 333 1.5.1 The United States ....................................... 333 Chart 190: United States Fluoropolymers Market Analysis (2012-2022) in Volume (Metric Tons) and Value (USD Million) .......................................................................... 333 1.5.1.1 Market Overview by Fluoropolymer Type . 334 Volume Analysis ..................................................... 334 Chart 191: United States Fluoropolymers Market Analysis (2012-2022) by Fluoropolymer Type – PTFE, FEP, PVDF, ETFE, PFA, PVF, PCTFE and ECTFE in Metric Tons .......... 334 Chart 192: Glance at 2012, 2017 and 2022 United States Fluoropolymers Volume Market Share (%) by Fluoropolymer Type – PTFE, FEP, PVDF, ETFE, PFA, PVF, PCTFE and ECTFE ........................................................... 335 Value Analysis ........................................................ 336 Chart 193: United States Fluoropolymers Market Analysis (2012-2022) by Fluoropolymer Type – PTFE, FEP, PVDF, ETFE, PFA, PVF, PCTFE and ECTFE in USD Million ........... 336 Chart 194: Glance at 2012, 2017 and 2022 United States Fluoropolymers Value Market Share (%) by Fluoropolymer Type – PTFE, FEP, PVDF, ETFE, PFA, PVF, PCTFE and ECTFE .. 337 1.5.1.2 Market Overview by End-use Sector .......... 338 Volume Analysis ..................................................... 338 Chart 195: United States Fluoropolymers Market Analysis (2012-2022) by End-use Sector – Chemical Processing, Electrical & Electronics, Mechanical/Industrial, Automotive & Transportation, Building & Construction and Others in Metric Tons ............................................. 338 Chart 196: Glance at 2012, 2017 and 2022 United States Fluoropolymers Volume Market Share (%) by End-use Sector – Chemical Processing, Electrical & Electronics, Mechanical/Industrial, Automotive & Transportation, Building & Construction and Others .............................. 339 Value Analysis ........................................................ 340 Chart 197: United States Fluoropolymers Market Analysis (2012-2022) by End-use Sector – Chemical Processing, Electrical & Electronics, Mechanical/Industrial, Automotive & Transportation, Building & Construction and Others in USD Million ............................................. 340 Chart 198: Glance at 2012, 2017 and 2022 United States Fluoropolymers Value Market Share (%) by End-use Sector – Chemical Processing, Electrical & Electronics, Mechanical/Industrial, Automotive & Transportation, Building & Construction and Others .............................. 341 1.5.2 Canada ....................................................... 342 Chart 199: Canadian Fluoropolymers Market Analysis (2012- 2022) in Volume (Metric Tons) and Value (USD Million) .. 342 1.5.2.1 Market Overview by Fluoropolymer Type . 343 Volume Analysis..................................................... 343 Chart 200: Canadian Fluoropolymers Market Analysis (2012-2022) by Fluoropolymer Type – PTFE, FEP, PVDF, ETFE and PFA in Metric Tons ......................................... 343 Chart 201: Glance at 2012, 2017 and 2022 Canadian Fluoropolymers Volume Market Share (%) by Fluoropolymer Type – PTFE, FEP, PVDF, ETFE and PFA .. 344 Value Analysis ........................................................ 345 Chart 202: Canadian Fluoropolymers Market Analysis (2012-2022) by Fluoropolymer Type – PTFE, FEP, PVDF, ETFE and PFA in USD Million ......................................... 345 Chart 203: Glance at 2012, 2017 and 2022 Canadian Fluoropolymers Value Market Share (%) by Fluoropolymer Type – PTFE, FEP, PVDF, ETFE and PFA .......................... 346 1.5.2.2 Market Overview by End-use Sector .......... 347 Volume Analysis..................................................... 347 Chart 204: Canadian Fluoropolymers Market Analysis (2012-2022) by End-use Sector – Chemical Processing, Electrical & Electronics, Mechanical/Industrial, Automotive & Transportation, Building & Construction and Others in Metric Tons ............................................ 347 Chart 205: Glance at 2012, 2017 and 2022 Canadian Fluoropolymers Volume Market Share (%) by End-use Sector – Chemical Processing, Electrical & Electronics, Mechanical/Industrial, Automotive & Transportation, Building & Construction and Others .............................. 348 Value Analysis ........................................................ 349 Chart 206: Canadian Fluoropolymers Market Analysis (2012-2022) by End-use Sector – Chemical Processing, Electrical & Electronics, Mechanical/Industrial, Automotive & Transportation, Building & Construction and Others in USD Million ............................................. 349 Chart 207: Glance at 2012, 2017 and 2022 Canadian Fluoropolymers Value Market Share (%) by End-use Sector – Chemical Processing, Electrical & Electronics, Mechanical/Industrial, Automotive & Transportation, Building & Construction and Others .............................. 350 1.5.3 Mexico ....................................................... 351 Chart 208: Mexican Fluoropolymers Market Analysis (2012- 2022) in Volume (Metric Tons) and Value (USD Million) .. 351 1.5.3.1 Market Overview by Fluoropolymer Type . 352 Volume Analysis..................................................... 352 Chart 209: Mexican Fluoropolymers Market Analysis (2012-2022) by Fluoropolymer Type – PTFE, FEP, PVDF, ETFE and PFA in Metric Tons ......................................... 352 Chart 210: Glance at 2012, 2017 and 2022 Mexican Fluoropolymers Volume Market Share (%) by Fluoropolymer Type – PTFE, FEP, PVDF, ETFE and PFA .. 353 Value Analysis ........................................................ 354 Chart 211: Mexican Fluoropolymers Market Analysis (2012-2022) by Fluoropolymer Type – PTFE, FEP, PVDF, ETFE and PFA in USD Million ......................................... 354 Chart 212: Glance at 2012, 2017 and 2022 Mexican Fluoropolymers Value Market Share (%) by Fluoropolymer Type – PTFE, FEP, PVDF, ETFE and PFA .......................... 355 1.5.3.2 Market Overview by End-use Sector .......... 356 Volume Analysis..................................................... 356 Chart 213: Mexican Fluoropolymers Market Analysis (2012-2022) by End-use Sector – Chemical Processing, Electrical & Electronics, Mechanical/Industrial, Automotive & Transportation, Building & Construction and Others in Metric Tons ............................................ 356 Chart 214: Glance at 2012, 2017 and 2022 Mexican Fluoropolymers Volume Market Share (%) by End-use Sector – Chemical Processing, Electrical & Electronics, Mechanical/Industrial, Automotive & Transportation, Building & Construction and Others .............................. 357 Value Analysis ........................................................ 358 Chart 215: Mexican Fluoropolymers Market Analysis (2012-2022) by End-use Sector – Chemical Processing, Electrical & Electronics, Mechanical/Industrial, Automotive & Transportation, Building & Construction and Others in USD Million ............................................. 358 Click here to buy the report Page 8
Global Fluoropolymers Market – Products, Technologies and Applications June 2016 |588 Pages | 408 Charts | Price $5760 HaloPolymer OJSC (Russia) ........................................... 393 Solvay Specialty Polymers France S.A.S. (France) .......... 394 Solvay Specialty Polymers Italy S.p.A. (Italy) ................. 394 2.5 European Fluoropolymers Market Overview by Country .................................................................. 395 2.5.1 France ........................................................ 395 Chart 246: French Fluoropolymers Market Analysis (2012- 2022) in Volume (Metric Tons) and Value (USD Million) 395 2.5.1.1 Market Overview by Fluoropolymer Type . 396 Volume Analysis..................................................... 396 Chart 247: French Fluoropolymers Market Analysis (2012- 2022) by Fluoropolymer Type – PTFE, FEP, PVDF, ETFE, PFA, PVF, PCTFE and ECTFE in Metric Tons ................... 396 Chart 248: Glance at 2012, 2017 and 2022 French Fluoropolymers Volume Market Share (%) by Fluoropolymer Type – PTFE, FEP, PVDF, ETFE, PFA, PVF, PCTFE and ECTFE ...... 397 Value Analysis ........................................................ 398 Chart 249: French Fluoropolymers Market Analysis (2012- 2022) by Fluoropolymer Type – PTFE, FEP, PVDF, ETFE, PFA, PVF, PCTFE and ECTFE in USD Million .................... 398 Chart 250: Glance at 2012, 2017 and 2022 French Fluoropolymers Value Market Share (%) by Fluoropolymer Type – PTFE, FEP, PVDF, ETFE, PFA, PVF, PCTFE and ECTFE .. 399 2.5.1.2 Market Overview by End-use Sector .......... 400 Volume Analysis..................................................... 400 Chart 251: French Fluoropolymers Market Analysis (2012- 2022) by End-use Sector – Chemical Processing, Electrical & Electronics, Mechanical/Industrial, Automotive & Transportation, Building & Construction and Others in Metric Tons ................................................................... 400 Chart 252: Glance at 2012, 2017 and 2022 French Fluoropolymers Volume Market Share (%) by End-use Sector – Chemical Processing, Electrical & Electronics, Mechanical/Industrial, Automotive & Transportation, Building & Construction and Others .............................. 401 Value Analysis ........................................................ 402 Chart 253: French Fluoropolymers Market Analysis (2012- 2022) by End-use Sector – Chemical Processing, Electrical & Electronics, Mechanical/Industrial, Automotive & Transportation, Building & Construction and Others in USD Million ........................................................................... 402 Chart 254: Glance at 2012, 2017 and 2022 French Fluoropolymers Value Market Share (%) by End-use Sector – Chemical Processing, Electrical & Electronics, Mechanical/Industrial, Automotive & Transportation, Building & Construction and Others .................................. 403 2.5.2 Germany .................................................... 404 Chart 255: German Fluoropolymers Market Analysis (2012- 2022) in Volume (Metric Tons) and Value (USD Million) .. 404 2.5.2.1 Market Overview by Fluoropolymer Type . 405 Volume Analysis..................................................... 405 Chart 256: German Fluoropolymers Market Analysis (2012-2022) by Fluoropolymer Type – PTFE, FEP, PVDF, ETFE, PFA, PVF, PCTFE and ECTFE in Metric Tons .......... 405 Chart 257: Glance at 2012, 2017 and 2022 German Fluoropolymers Volume Market Share (%) by Fluoropolymer Type – PTFE, FEP, PVDF, ETFE, PFA, PVF, PCTFE and ECTFE .. 406 Value Analysis ........................................................ 407 Chart 258: German Fluoropolymers Market Analysis (2012-2022) by Fluoropolymer Type – PTFE, FEP, PVDF, ETFE, PFA, PVF, PCTFE and ECTFE in USD Million .......... 407 Chart 259: Glance at 2012, 2017 and 2022 German Fluoropolymers Value Market Share (%) by Fluoropolymer Type – PTFE, FEP, PVDF, ETFE, PFA, PVF, PCTFE and ECTFE .. 408 2.5.2.2 Market Overview by End-use Sector .......... 409 Volume Analysis..................................................... 409 Chart 260: German Fluoropolymers Market Analysis (2012-2022) by End-use Sector – Chemical Processing, Electrical & Electronics, Mechanical/Industrial, Automotive & Transportation, Building & Construction and Others in Metric Tons ............................................ 409 Chart 261: Glance at 2012, 2017 and 2022 German Fluoropolymers Volume Market Share (%) by End-use Sector – Chemical Processing, Electrical & Electronics, Mechanical/Industrial, Automotive & Transportation, Building & Construction and Others .............................. 410 2.3.1.2 Fluorinated Ethylene Propylene (FEP) ........ 375 Chart 232: European Fluorinated Ethylene Propylene (FEP) Market Analysis (2012, 2016 and 2022) by End-use Sector – Chemical Processing, Electrical & Electronics, Mechanical/Industrial, Automotive & Transportation and Others in Metric Tons ........................................................ 375 Chart 233: European Fluorinated Ethylene Propylene (FEP) Market Analysis (2012, 2016 and 2022) by End-use Sector – Chemical Processing, Electrical & Electronics, Mechanical/Industrial, Automotive & Transportation and Others in USD Million ........................................................ 376 2.3.1.3 Polyvinylidene Fluoride (PVDF) .................. 377 Chart 234: European Polyvinylidene Fluoride (PVDF) Market Analysis (2012, 2016 and 2022) by End-use Sector – Chemical Processing, Electrical & Electronics, Mechanical/Industrial, Automotive & Transportation, Building & Construction and Others in Metric Tons ......... 377 Chart 235: European Polyvinylidene Fluoride (PVDF) Market Analysis (2012, 2016 and 2022) by End-use Sector – Chemical Processing, Electrical & Electronics, Mechanical/Industrial, Automotive & Transportation, Building & Construction and Others in USD Million .......... 378 2.3.1.4 Ethylene Tetrafluoroethylene (ETFE) ......... 379 Chart 236: European Ethylene Tetrafluoroethylene (ETFE) Market Analysis (2012, 2016 and 2022) by End-use Sector – Chemical Processing, Electrical & Electronics, Mechanical/Industrial, Automotive & Transportation, Building & Construction and Others in Metric Tons ......... 379 Chart 237: European Ethylene Tetrafluoroethylene (ETFE) Market Analysis (2012, 2016 and 2022) by End-use Sector – Chemical Processing, Electrical & Electronics, Mechanical/Industrial, Automotive & Transportation, Building & Construction and Others in USD Million .......... 380 2.3.1.5 Perfluoroalkoxy (PFA) ................................ 381 Chart 238: European Perfluoroalkoxy (PFA) Market Analysis (2012, 2016 and 2022) by End-use Sector – Chemical Processing, Electrical & Electronics, Mechanical/Industrial, Automotive & Transportation and Others in Metric Tons .................................................... 381 Chart 239: European Perfluoroalkoxy (PFA) Market Analysis (2012, 2016 and 2022) by End-use Sector – Chemical Processing, Electrical & Electronics, Mechanical/Industrial, Automotive & Transportation and Others in USD Million .................................................... 382 2.3.1.6 Polyvinyl Fluoride (PVF) ............................. 383 Chart 240: European Polyvinyl Fluoride (PVF) Market Analysis (2012, 2016 and 2022) by End-use Sector – Electrical & Electronics, Automotive & Transportation and Others in Metric Tons .................................................... 383 Chart 241: European Polyvinyl Fluoride (PVF) Market Analysis (2012, 2016 and 2022) by End-use Sector – Electrical & Electronics, Automotive & Transportation and Others in USD Million .................................................... 384 2.3.1.7 Polychlorotrifluoroethylene (PCTFE) .......... 385 Chart 242: European Polychlorotrifluoroethylene (PCTFE) Market Analysis (2012, 2016 and 2022) by End-use Sector – Chemical Processing, Electrical & Electronics, Mechanical/Industrial and Others in Metric Tons ............ 385 Chart 243: European Polychlorotrifluoroethylene (PCTFE) Market Analysis (2012, 2016 and 2022) by End-use Sector – Chemical Processing, Electrical & Electronics, Mechanical/Industrial and Others in USD Million ............. 386 2.3.1.8 Ethylene Chlorotrifluoroethylene (ECTFE) . 387 Chart 244: European Ethylene Chlorotrifluoroethylene (ECTFE) Market Analysis (2012, 2016 and 2022) by End-use Sector – Chemical Processing, Electrical & Electronics, Mechanical/Industrial, Automotive & Transportation, Building & Construction and Others in Metric Tons ....... 387 Chart 245: European Ethylene Chlorotrifluoroethylene (ECTFE) Market Analysis (2012, 2016 and 2022) by End-use Sector – Chemical Processing, Electrical & Electronics, Mechanical/Industrial, Automotive & Transportation, Building & Construction and Others in USD Million ....... 388 2.4 Major Market Players ...................................... 389 AGC Chemicals Europe Ltd. (United Kingdom)............... 389 Arkema Group (France) ................................................. 390 Chemours Netherlands B.V. (Netherlands) .................... 391 Dyneon GmbH & Co. KG (Germany) .............................. 392 Value Analysis ........................................................ 411 Chart 262: German Fluoropolymers Market Analysis (2012-2022) by End-use Sector – Chemical Processing, Electrical & Electronics, Mechanical/Industrial, Automotive & Transportation, Building & Construction and Others in USD Million ............................................ 411 Chart 263: Glance at 2012, 2017 and 2022 German Fluoropolymers Value Market Share (%) by End-use Sector – Chemical Processing, Electrical & Electronics, Mechanical/Industrial, Automotive & Transportation, Building & Construction and Others .................................. 412 2.5.3 Italy ........................................................... 413 Chart 264: Italian Fluoropolymers Market Analysis (2012- 2022) in Volume (Metric Tons) and Value (USD Million) .. 413 2.5.3.1 Market Overview by Fluoropolymer Type . 414 Volume Analysis .................................................... 414 Chart 265: Italian Fluoropolymers Market Analysis (2012- 2022) by Fluoropolymer Type – PTFE, FEP, PVDF, ETFE, PFA, PVF, PCTFE and ECTFE in Metric Tons ................... 414 Chart 266: Glance at 2012, 2017 and 2022 Italian Fluoropolymers Volume Market Share (%) by Fluoropolymer Type – PTFE, FEP, PVDF, ETFE, PFA, PVF, PCTFE and ECTFE .. 415 Value Analysis ........................................................ 416 Chart 267: Italian Fluoropolymers Market Analysis (2012- 2022) by Fluoropolymer Type – PTFE, FEP, PVDF, ETFE, PFA, PVF, PCTFE and ECTFE in USD Million ................... 416 Chart 268: Glance at 2012, 2017 and 2022 Italian Fluoropolymers Value Market Share (%) by Fluoropolymer Type – PTFE, FEP, PVDF, ETFE, PFA, PVF, PCTFE and ECTFE .. 417 2.5.3.2 Market Overview by End-use Sector .......... 418 Volume Analysis .................................................... 418 Chart 269: Italian Fluoropolymers Market Analysis (2012- 2022) by End-use Sector – Chemical Processing, Electrical & Electronics, Mechanical/Industrial, Automotive & Transportation, Building & Construction and Others in Metric Tons .................................................................. 418 Chart 270: Glance at 2012, 2017 and 2022 Italian Fluoropolymers Volume Market Share (%) by End-use Sector – Chemical Processing, Electrical & Electronics, Mechanical/Industrial, Automotive & Transportation, Building & Construction and Others ............................. 419 Value Analysis ........................................................ 420 Chart 271: Italian Fluoropolymers Market Analysis (2012-2022) by End-use Sector – Chemical Processing, Electrical & Electronics, Mechanical/Industrial, Automotive & Transportation, Building & Construction and Others in USD Million ..................................... 420 Chart 272: Glance at 2012, 2017 and 2022 Italian Fluoropolymers Value Market Share (%) by End-use Sector – Chemical Processing, Electrical & Electronics, Mechanical/Industrial, Automotive & Transportation, Building & Construction and Others .................................. 421 2.5.4 Russia ........................................................ 422 Chart 273: Russian Fluoropolymers Market Analysis (2012- 2022) in Volume (Metric Tons) and Value (USD Million) .. 422 2.5.4.1 Market Overview by Fluoropolymer Type . 423 Volume Analysis .................................................... 423 Chart 274: Russian Fluoropolymers Market Analysis (2012- 2022) by Fluoropolymer Type – PTFE, FEP, PVDF, ETFE and PFA in Metric Tons ........................................................ 423 Chart 275: Glance at 2012, 2017 and 2022 Russian Fluoropolymers Volume Market Share (%) by Fluoropolymer Type – PTFE, FEP, PVDF, ETFE and PFA . 424 Value Analysis ........................................................ 425 Chart 276: Russian Fluoropolymers Market Analysis (2012- 2022) by Fluoropolymer Type – PTFE, FEP, PVDF, ETFE and PFA in USD Million ........................................................ 425 Chart 277: Glance at 2012, 2017 and 2022 Russian Fluoropolymers Value Market Share (%) by Fluoropolymer Type – PTFE, FEP, PVDF, ETFE and PFA ......................... 426 2.5.4.2 Market Overview by End-use Sector .......... 427 Volume Analysis .................................................... 427 Chart 278: Russian Fluoropolymers Market Analysis (2012- 2022) by End-use Sector – Chemical Processing, Electrical & Electronics, Mechanical/Industrial, Automotive & Transportation, Building & Construction and Others in Metric Tons .................................................................. 427 Click here to buy the report Page 9
Global Fluoropolymers Market – Products, Technologies and Applications June 2016 |588 Pages | 408 Charts | Price $5760 Chart 279: Glance at 2012, 2017 and 2022 Russian Fluoropolymers Volume Market Share (%) by End-use Sector – Chemical Processing, Electrical & Electronics, Mechanical/Industrial, Automotive & Transportation, Building & Construction and Others .............................. 428 Value Analysis ........................................................ 429 Chart 280: Russian Fluoropolymers Market Analysis (2012- 2022) by End-use Sector – Chemical Processing, Electrical & Electronics, Mechanical/Industrial, Automotive & Transportation, Building & Construction and Others in USD Million ........................................................................... 429 Chart 281: Glance at 2012, 2017 and 2022 Russian Fluoropolymers Value Market Share (%) by End-use Sector – Chemical Processing, Electrical & Electronics, Mechanical/Industrial, Automotive & Transportation, Building & Construction and Others .............................. 430 2.5.5 The United Kingdom .................................. 431 Chart 282: UK Fluoropolymers Market Analysis (2012-2022) in Volume (Metric Tons) and Value (USD Million) ............ 431 2.5.5.1 Market Overview by Fluoropolymer Type . 432 Volume Analysis ..................................................... 432 Chart 283: UK Fluoropolymers Market Analysis (2012- 2022) by Fluoropolymer Type – PTFE, FEP, PVDF, ETFE, PFA, PCTFE and ECTFE in Metric Tons ............................ 432 Chart 284: Glance at 2012, 2017 and 2022 UK Fluoropolymers Volume Market Share (%) by Fluoropolymer Type – PTFE, FEP, PVDF, ETFE, PFA, PCTFE and ECTFE ...................................................................... 433 Value Analysis ........................................................ 434 Chart 285: UK Fluoropolymers Market Analysis (2012- 2022) by Fluoropolymer Type – PTFE, FEP, PVDF, ETFE, PFA, PCTFE and ECTFE in USD Million ............................ 434 Chart 286: Glance at 2012, 2017 and 2022 UK Fluoropolymers Value Market Share (%) by Fluoropolymer Type – PTFE, FEP, PVDF, ETFE, PFA, PCTFE and ECTFE ... 435 2.5.5.2 Market Overview by End-use Sector .......... 436 Volume Analysis ..................................................... 436 Chart 287: UK Fluoropolymers Market Analysis (2012- 2022) by End-use Sector – Chemical Processing, Electrical & Electronics, Mechanical/Industrial, Automotive & Transportation, Building & Construction and Others in Metric Tons ................................................................... 436 Chart 288: Glance at 2012, 2017 and 2022 UK Fluoropolymers Volume Market Share (%) by End-use Sector – Chemical Processing, Electrical & Electronics, Mechanical/Industrial, Automotive & Transportation, Building & Construction and Others .............................. 437 Value Analysis ........................................................ 438 Chart 289: UK Fluoropolymers Market Analysis (2012- 2022) by End-use Sector – Chemical Processing, Electrical & Electronics, Mechanical/Industrial, Automotive & Transportation, Building & Construction and Others in USD Million ........................................................................... 438 Chart 290: Glance at 2012, 2017 and 2022 UK Fluoropolymers Value Market Share (%) by End-use Sector – Chemical Processing, Electrical & Electronics, Mechanical/Industrial, Automotive & Transportation, Building & Construction and Others .............................. 439 2.5.6 Rest of Europe ........................................... 440 Chart 291: Rest of Europe Fluoropolymers Market Analysis (2012- 2022) in Volume (Metric Tons) and Value (USD Million) ............... 440 2.5.6.1 Market Overview by Fluoropolymer Type . 441 Volume Analysis ..................................................... 441 Chart 292: Rest of Europe Fluoropolymers Market Analysis (2012-2022) by Fluoropolymer Type – PTFE, FEP, PVDF, ETFE, PFA, PVF, PCTFE and ECTFE in Metric Tons .......... 441 Chart 293: Glance at 2012, 2017 and 2022 Rest of Europe Fluoropolymers Volume Market Share (%) by Fluoropolymer Type – PTFE, FEP, PVDF, ETFE, PFA, PVF, PCTFE and ECTFE ........................................................... 442 Value Analysis ........................................................ 443 Chart 294: Rest of Europe Fluoropolymers Market Analysis (2012-2022) by Fluoropolymer Type – PTFE, FEP, PVDF, ETFE, PFA, PVF, PCTFE and ECTFE in USD Million ........... 443 Chart 295: Glance at 2012, 2017 and 2022 Rest of Europe Fluoropolymers Value Market Share (%) by Fluoropolymer Type – PTFE, FEP, PVDF, ETFE, PFA, PVF, PCTFE and ECTFE ............... 444 Chart 312: Glance at 2012, 2017 and 2022 Asia-Pacific Fluoropolymers Value Market Share (%) by End-use Sector – Chemical Processing, Electrical & Electronics, Mechanical/Industrial, Automotive & Transportation, Building & Construction and Others ............................. 461 3.3.1 Fluoropolymers Type Market Overview by End- use Sector .............................................................. 462 3.3.1.1 Polytetrafluoroethylene (PTFE) .................. 462 Chart 313: Asia-Pacific Polytetrafluoroethylene (PTFE) Market Analysis (2012, 2016 and 2022) by End-use Sector – Chemical Processing, Electrical & Electronics, Mechanical/Industrial, Automotive & Transportation, Building & Construction and Others in Metric Tons ......... 462 Chart 314: Asia-Pacific Polytetrafluoroethylene (PTFE) Market Analysis (2012, 2016 and 2022) by End-use Sector – Chemical Processing, Electrical & Electronics, Mechanical/Industrial, Automotive & Transportation, Building & Construction and Others in USD Million .......... 463 3.3.1.2 Fluorinated Ethylene Propylene (FEP) ....... 464 Chart 315: Asia-Pacific Fluorinated Ethylene Propylene (FEP) Market Analysis (2012, 2016 and 2022) by End-use Sector – Chemical Processing, Electrical & Electronics, Mechanical/Industrial, Automotive & Transportation and Others in Metric Tons ................................................... 464 Chart 316: Asia-Pacific Fluorinated Ethylene Propylene (FEP) Market Analysis (2012, 2016 and 2022) by End-use Sector – Chemical Processing, Electrical & Electronics, Mechanical/Industrial, Automotive & Transportation and Others in USD Million ................................................... 465 3.3.1.3 Polyvinylidene Fluoride (PVDF) .................. 466 Chart 317: Asia-Pacific Polyvinylidene Fluoride (PVDF) Market Analysis (2012, 2016 and 2022) by End-use Sector – Chemical Processing, Electrical & Electronics, Mechanical/Industrial, Automotive & Transportation, Building & Construction and Others in Metric Tons ......... 466 Chart 318: Asia-Pacific Polyvinylidene Fluoride (PVDF) Market Analysis (2012, 2016 and 2022) by End-use Sector – Chemical Processing, Electrical & Electronics, Mechanical/Industrial, Automotive & Transportation, Building & Construction and Others in USD Million .......... 467 3.3.1.4 Ethylene Tetrafluoroethylene (ETFE) ......... 468 Chart 319: Asia-Pacific Ethylene Tetrafluoroethylene (ETFE) Market Analysis (2012, 2016 and 2022) by End-use Sector – Chemical Processing, Electrical & Electronics, Mechanical/Industrial, Automotive & Transportation, Building & Construction and Others in Metric Tons ...... 468 Chart 320: Asia-Pacific Ethylene Tetrafluoroethylene (ETFE) Market Analysis (2012, 2016 and 2022) by End-use Sector – Chemical Processing, Electrical & Electronics, Mechanical/Industrial, Automotive & Transportation, Building & Construction and Others in USD Million ...... 469 3.3.1.5 Perfluoroalkoxy (PFA) ................................ 470 Chart 321: Asia-Pacific Perfluoroalkoxy (PFA) Market Analysis (2012, 2016 and 2022) by End-use Sector – Chemical Processing, Electrical & Electronics, Mechanical/Industrial, Automotive & Transportation and Others in Metric Tons ................................................... 470 Chart 322: Asia-Pacific Perfluoroalkoxy (PFA) Market Analysis (2012, 2016 and 2022) by End-use Sector – Chemical Processing, Electrical & Electronics, Mechanical/Industrial, Automotive & Transportation and Others in USD Million ................................................... 471 3.3.1.6 Polychlorotrifluoroethylene (PCTFE) .......... 472 Chart 323: Asia-Pacific Polychlorotrifluoroethylene (PCTFE) Market Analysis (2012, 2016 and 2022) by End-use Sector – Chemical Processing, Electrical & Electronics, Mechanical/Industrial, Pharma Packaging and Others in Metric Tons ........................................................................ 472 Chart 324: Asia-Pacific Polychlorotrifluoroethylene (PCTFE) Market Analysis (2012, 2016 and 2022) by End-use Sector – Chemical Processing, Electrical & Electronics, Mechanical/Industrial, Pharma Packaging and Others in USD Million ................................................................... 473 3.3.1.7 Ethylene Chlorotrifluoroethylene (ECTFE) . 474 Chart 325: Asia-Pacific Ethylene Chlorotrifluoroethylene (ECTFE) Market Analysis (2012, 2016 and 2022) by End-use Sector – Chemical Processing, Electrical & Electronics, Mechanical/Industrial and Others in Metric Tons ......... 474 2.5.6.2 Market Overview by End-use Sector .......... 445 Volume Analysis..................................................... 445 Chart 296: Rest of Europe Fluoropolymers Market Analysis (2012-2022) by End-use Sector – Chemical Processing, Electrical & Electronics, Mechanical/Industrial, Automotive & Transportation, Building & Construction and Others in Metric Tons ............................................ 445 Chart 297: Glance at 2012, 2017 and 2022 Rest of Europe Fluoropolymers Volume Market Share (%) by End-use Sector – Chemical Processing, Electrical & Electronics, Mechanical/Industrial, Automotive & Transportation, Building & Construction and Others .............................. 446 Value Analysis ........................................................ 447 Chart 298: Rest of Europe Fluoropolymers Market Analysis (2012-2022) by End-use Sector – Chemical Processing, Electrical & Electronics, Mechanical/Industrial, Automotive & Transportation, Building & Construction and Others in USD Million ............................................. 447 Chart 299: Glance at 2012, 2017 and 2022 Rest of Europe Fluoropolymers Value Market Share (%) by End-use Sector – Chemical Processing, Electrical & Electronics, Mechanical/Industrial, Automotive & Transportation, Building & Construction and Others .............................. 448 3. ASIA-PACIFIC ................................................... 449 Chart 300: Asia-Pacific Fluoropolymers Market Analysis (2012-2022) in Volume (Metric Tons) and Value (USD Million) ......................................................................... 449 3.1 Market Overview by Geographic Region ......... 450 Volume Analysis..................................................... 450 Chart 301: Asia-Pacific Fluoropolymers Market Analysis (2012-2022) by Region – China, Japan, India, South Korea and Rest of Asia-Pacific in Metric Tons.......................... 450 Chart 302: Glance at 2012, 2017 and 2022 Asia-Pacific Fluoropolymers Volume Market Share (%) by Region – China, Japan, India, South Korea and Rest of Asia-Pacific ................ 451 Value Analysis ........................................................ 452 Chart 303: Asia-Pacific Fluoropolymers Market Analysis (2012-2022) by Region – China, Japan, India, South Korea and Rest of Asia-Pacific in USD Million .......................... 452 Chart 304: Glance at 2012, 2017 and 2022 Asia-Pacific Fluoropolymers Value Market Share (%) by Region – China, Japan, India, South Korea and Rest of Asia-Pacific ............ 453 3.2 Market Overview by Fluoropolymer Type ....... 454 Volume Analysis..................................................... 454 Chart 305: Asia-Pacific Fluoropolymers Market Analysis (2012-2022) by Fluoropolymer Type – PTFE, FEP, PVDF, ETFE, PFA, PCTFE and ECTFE in Metric Tons .................. 454 Chart 306: Glance at 2012, 2017 and 2022 Asia-Pacific Fluoropolymers Volume Market Share (%) by Fluoropolymer Type – PTFE, FEP, PVDF, ETFE, PFA, PCTFE and ECTFE ..................................................................... 455 Value Analysis ........................................................ 456 Chart 307: Asia-Pacific Fluoropolymers Market Analysis (2012-2022) by Fluoropolymer Type – PTFE, FEP, PVDF, ETFE, PFA, PCTFE and ECTFE in USD Million .................. 456 Chart 308: Glance at 2012, 2017 and 2022 Asia-Pacific Fluoropolymers Value Market Share (%) by Fluoropolymer Type – PTFE, FEP, PVDF, ETFE, PFA, PCTFE and ECTFE ... 457 3.3 Market Overview by End-use Sector ................ 458 Volume Analysis..................................................... 458 Chart 309: Asia-Pacific Fluoropolymers Market Analysis (2012-2022) by End-use Sector – Chemical Processing, Electrical & Electronics, Mechanical/Industrial, Automotive & Transportation, Building & Construction and Others in Metric Tons ............................................ 458 Chart 310: Glance at 2012, 2017 and 2022 Asia-Pacific Fluoropolymers Volume Market Share (%) by End-use Sector – Chemical Processing, Electrical & Electronics, Mechanical/Industrial, Automotive & Transportation, Building & Construction and Others .............................. 459 Value Analysis ........................................................ 460 Chart 311: Asia-Pacific Fluoropolymers Market Analysis (2012-2022) by End-use Sector – Chemical Processing, Electrical & Electronics, Mechanical/Industrial, Automotive & Transportation, Building & Construction and Others in USD Million ............................................. 460 Click here to buy the report Page 10
Global Fluoropolymers Market – Products, Technologies and Applications June 2016 |588 Pages | 408 Charts | Price $5760 Chart 326: Asia-Pacific Ethylene Chlorotrifluoroethylene (ECTFE) Market Analysis (2012, 2016 and 2022) by End-use Sector – Chemical Processing, Electrical & Electronics, Mechanical/Industrial and Others in USD Million .......... 475 3.4 Major Market Players ...................................... 476 Arkema (Changshu) Fluorochemical Co., Ltd. (China) .... 476 Asahi Glass Co Ltd (Japan) ............................................. 477 Changshu Xinhua Chemical Co Ltd (China) .................... 479 Daikin Fluorochemicals (China) Co Ltd (China) .............. 479 Daikin Industries Ltd (Japan).......................................... 480 Dongyue Group Limited (China) .................................... 481 Du Pont-Mitsui Fluorochemicals Co Ltd (Japan) ............ 482 Fuxin Hengtong Fluorine Chemicals Co, Ltd (China) ...... 483 Guangzhou Lichang Fluorine Plastic Co Ltd (China) ....... 483 Gujarat Fluorochemicals Limited (India) ........................ 484 Hindustan Fluorocarbons Limited (India)....................... 486 Jiangsu Huaao High-Tech Development Co Ltd (China) . 487 Jiangsu Meilan Chemical Co Ltd (China) ........................ 488 Jinhua Yonghe Fluorochemical Co Ltd (China) ............... 489 Kureha (Changshu) Fluoropolymers Co Ltd (China) ....... 489 Kureha Corporation (Japan)........................................... 490 Longxing Chemical Stock Co Ltd (China) ........................ 491 Shandong Huafu Fluoro-Chemical Co Ltd (Jinan 3F) (China) . 491 Shanghai 3F New Material Co Ltd (China) ...................... 492 Shanghai Ofluorine Chemical Technology Co Ltd (China) ..... 493 Solvay Specialty Polymers (Changshu) Co., Ltd (China) .. 494 The Chemours (Changshu) Fluoro Technology Company Limited (China) .............................................................. 494 Zhejiang Fotech International Co Ltd (China) ................. 494 Zhejiang Juhua Co Ltd (China)........................................ 495 Zhejiang Lantian Environmental Protection Fluoro Materials Co., Ltd. (China) ............................................. 496 Zhonghao Chenguang Research Institute Chemical Industry (China) ............................................................. 496 3.5.2 Japan ......................................................... 506 Chart 336: Japanese Fluoropolymers Market Analysis (2012- 2022) in Volume (Metric Tons) and Value (USD Million) .. 506 3.5.2.1 Market Overview by Fluoropolymer Type . 507 Volume Analysis..................................................... 507 Chart 337: Japanese Fluoropolymers Market Analysis (2012-2022) by Fluoropolymer Type – PTFE, FEP, PVDF, ETFE, PFA, PCTFE and ECTFE in Metric Tons .................. 507 Chart 338: Glance at 2012, 2017 and 2022 Japanese Fluoropolymers Volume Market Share (%) by Fluoropolymer Type – PTFE, FEP, PVDF, ETFE, PFA, PCTFE and ECTFE ...... 508 Value Analysis ........................................................ 509 Chart 339: Japanese Fluoropolymers Market Analysis (2012-2022) by Fluoropolymer Type – PTFE, FEP, PVDF, ETFE, PFA, PCTFE and ECTFE in USD Million .................. 509 Chart 340: Glance at 2012, 2017 and 2022 Japanese Fluoropolymers Value Market Share (%) by Fluoropolymer Type – PTFE, FEP, PVDF, ETFE, PFA, PCTFE and ECTFE ... 510 3.5.2.2 Market Overview by End-use Sector .......... 511 Volume Analysis..................................................... 511 Chart 341: Japanese Fluoropolymers Market Analysis (2012-2022) by End-use Sector – Chemical Processing, Electrical & Electronics, Mechanical/Industrial, Automotive & Transportation, Building & Construction and Others in Metric Tons ............................................ 511 Chart 342: Glance at 2012, 2017 and 2022 Japanese Fluoropolymers Volume Market Share (%) by End-use Sector – Chemical Processing, Electrical & Electronics, Mechanical/Industrial, Automotive & Transportation, Building & Construction and Others .............................. 512 Value Analysis ........................................................ 513 Chart 343: Japanese Fluoropolymers Market Analysis (2012-2022) by End-use Sector – Chemical Processing, Electrical & Electronics, Mechanical/Industrial, Automotive & Transportation, Building & Construction and Others in USD Million ............................................. 513 Chart 344: Glance at 2012, 2017 and 2022 Japanese Fluoropolymers Value Market Share (%) by End-use Sector – Chemical Processing, Electrical & Electronics, Mechanical/Industrial, Automotive & Transportation, Building & Construction and Others .................................. 514 3.5.3 India .......................................................... 515 Chart 345: Indian Fluoropolymers Market Analysis (2012- 2022) in Volume (Metric Tons) and Value (USD Million) .. 515 3.5.3.1 Market Overview by Fluoropolymer Type . 516 Volume Analysis..................................................... 516 Chart 346: Indian Fluoropolymers Market Analysis (2012- 2022) by Fluoropolymer Type – PTFE, FEP, PVDF, ETFE, PFA and ECTFE in Metric Tons .............................................. 516 Chart 347: Glance at 2012, 2017 and 2022 Indian Fluoropolymers Volume Market Share (%) by Fluoropolymer Type – PTFE, FEP, PVDF, ETFE, PFA and ECTFE .................. 517 Value Analysis ........................................................ 518 Chart 348: Indian Fluoropolymers Market Analysis (2012- 2022) by Fluoropolymer Type – PTFE, FEP, PVDF, ETFE, PFA and ECTFE in USD Million .............................................. 518 Chart 349: Glance at 2012, 2017 and 2022 Indian Fluoropolymers Value Market Share (%) by Fluoropolymer Type – PTFE, FEP, PVDF, ETFE, PFA and ECTFE .............. 519 3.5.3.2 Market Overview by End-use Sector .......... 520 Volume Analysis..................................................... 520 Chart 350: Indian Fluoropolymers Market Analysis (2012- 2022) by End-use Sector – Chemical Processing, Electrical & Electronics, Mechanical/Industrial, Automotive & Transportation, Building & Construction and Others in Metric Tons ................................................................... 520 Chart 351: Glance at 2012, 2017 and 2022 Indian Fluoropolymers Volume Market Share (%) by End-use Sector – Chemical Processing, Electrical & Electronics, Mechanical/Industrial, Automotive & Transportation, Building & Construction and Others .............................. 521 Value Analysis ........................................................ 522 Chart 352: Indian Fluoropolymers Market Analysis (2012- 2022) by End-use Sector – Chemical Processing, Electrical & Electronics, Mechanical/Industrial, Automotive & Transportation, Building & Construction and Others in USD Million ........................................................................... 522 Chart 353: Glance at 2012, 2017 and 2022 Indian Fluoropolymers Value Market Share (%) by End-use Sector – Chemical Processing, Electrical & Electronics, Mechanical/Industrial, Automotive & Transportation, Building & Construction and Others .................................. 523 3.5.4 South Korea ............................................... 524 Chart 354: South Korean Fluoropolymers Market Analysis (2012-2022) in Volume (Metric Tons) and Value (USD Million) ......................................................................... 524 3.5.4.1 Market Overview by Fluoropolymer Type . 525 Volume Analysis .................................................... 525 Chart 355: South Korean Fluoropolymers Market Analysis (2012-2022) by Fluoropolymer Type – PTFE, FEP, PVDF, ETFE, PFA, PCTFE and ECTFE in Metric Tons ................. 525 Chart 356: Glance at 2012, 2017 and 2022 South Korean Fluoropolymers Volume Market Share (%) by Fluoropolymer Type – PTFE, FEP, PVDF, ETFE, PFA, PCTFE and ECTFE ..................................................................... 526 Value Analysis ........................................................ 527 Chart 357: South Korean Fluoropolymers Market Analysis (2012-2022) by Fluoropolymer Type – PTFE, FEP, PVDF, ETFE, PFA, PCTFE and ECTFE in USD Million .................. 527 Chart 358: Glance at 2012, 2017 and 2022 South Korean Fluoropolymers Value Market Share (%) by Fluoropolymer Type – PTFE, FEP, PVDF, ETFE, PFA, PCTFE and ECTFE .. 528 3.5.4.2 Market Overview by End-use Sector .......... 529 Volume Analysis .................................................... 529 Chart 359: South Korean Fluoropolymers Market Analysis (2012-2022) by End-use Sector – Chemical Processing, Electrical & Electronics, Mechanical/Industrial, Automotive & Transportation, Building & Construction and Others in Metric Tons ............................................ 529 Chart 360: Glance at 2012, 2017 and 2022 South Korean Fluoropolymers Volume Market Share (%) by End-use Sector – Chemical Processing, Electrical & Electronics, Mechanical/Industrial, Automotive & Transportation, Building & Construction and Others ............................. 530 Value Analysis ........................................................ 531 Chart 361: South Korean Fluoropolymers Market Analysis (2012-2022) by End-use Sector – Chemical Processing, Electrical & Electronics, Mechanical/Industrial, Automotive & Transportation, Building & Construction and Others in USD Million ............................................ 531 Chart 362: Glance at 2012, 2017 and 2022 South Korean Fluoropolymers Value Market Share (%) by End-use Sector – Chemical Processing, Electrical & Electronics, Mechanical/Industrial, Automotive & Transportation, Building & Construction and Others ............................. 532 3.5 Asia-Pacific Fluoropolymers Market Overview by Country .................................................................. 497 3.5.1 China ......................................................... 497 Chart 327: Chinese Fluoropolymers Market Analysis (2012- 2022) in Volume (Metric Tons) and Value (USD Million) 497 3.5.1.1 Market Overview by Fluoropolymer Type . 498 Volume Analysis ..................................................... 498 Chart 328: Chinese Fluoropolymers Market Analysis (2012- 2022) by Fluoropolymer Type – PTFE, FEP, PVDF, ETFE, PFA, PCTFE and ECTFE in Metric Tons ............................ 498 Chart 329: Glance at 2012, 2017 and 2022 Chinese Fluoropolymers Volume Market Share (%) by Fluoropolymer Type – PTFE, FEP, PVDF, ETFE, PFA, PCTFE and ECTFE ...... 499 Value Analysis ........................................................ 500 Chart 330: Chinese Fluoropolymers Market Analysis (2012- 2022) by Fluoropolymer Type – PTFE, FEP, PVDF, ETFE, PFA, PCTFE and ECTFE in USD Million ............................ 500 Chart 331: Glance at 2012, 2017 and 2022 Chinese Fluoropolymers Value Market Share (%) by Fluoropolymer Type – PTFE, FEP, PVDF, ETFE, PFA, PCTFE and ECTFE ... 501 3.5.1.2 Market Overview by End-use Sector .......... 502 Volume Analysis ..................................................... 502 Chart 332: Chinese Fluoropolymers Market Analysis (2012- 2022) by End-use Sector – Chemical Processing, Electrical & Electronics, Mechanical/Industrial, Automotive & Transportation, Building & Construction and Others in Metric Tons ................................................................... 502 Chart 333: Glance at 2012, 2017 and 2022 Chinese Fluoropolymers Volume Market Share (%) by End-use Sector – Chemical Processing, Electrical & Electronics, Mechanical/Industrial, Automotive & Transportation, Building & Construction and Others .............................. 503 Value Analysis ........................................................ 504 Chart 334: Chinese Fluoropolymers Market Analysis (2012- 2022) by End-use Sector – Chemical Processing, Electrical & Electronics, Mechanical/Industrial, Automotive & Transportation, Building & Construction and Others in USD Million ........................................................................... 504 Chart 335: Glance at 2012, 2017 and 2022 Chinese Fluoropolymers Value Market Share (%) by End-use Sector – Chemical Processing, Electrical & Electronics, Mechanical/Industrial, Automotive & Transportation, Building & Construction and Others .................................. 505 3.5.5 Rest of Asia-Pacific ..................................... 533 Chart 363: Rest of Asia-Pacific Fluoropolymers Market Analysis (2012-2022) in Volume (Metric Tons) and Value (USD Million) ................................................................ 533 3.5.5.1 Market Overview by Fluoropolymer Type . 534 Volume Analysis .................................................... 534 Chart 364: Rest of Asia-Pacific Fluoropolymers Market Analysis (2012-2022) by Fluoropolymer Type – PTFE, FEP, PVDF, ETFE, PFA, PCTFE and ECTFE in Metric Tons ....... 534 Chart 365: Glance at 2012, 2017 and 2022 Rest of Asia- Pacific Fluoropolymers Volume Market Share (%) by Fluoropolymer Type – PTFE, FEP, PVDF, ETFE, PFA, PCTFE and ECTFE ..................................................................... 535 Value Analysis ........................................................ 536 Chart 366: Rest of Asia-Pacific Fluoropolymers Market Analysis (2012-2022) by Fluoropolymer Type – PTFE, FEP, PVDF, ETFE, PFA, PCTFE and ECTFE in USD Million........ 536 Chart 367: Glance at 2012, 2017 and 2022 Rest of Asia- Pacific Fluoropolymers Value Market Share (%) by Fluoropolymer Type – PTFE, FEP, PVDF, ETFE, PFA, PCTFE and ECTFE ..................................................................... 537 3.5.5.2 Market Overview by End-use Sector .......... 538 Volume Analysis .................................................... 538 Chart 368: Rest of Asia-Pacific Fluoropolymers Market Analysis (2012-2022) by End-use Sector – Chemical Processing, Electrical & Electronics, Mechanical/Industrial, Automotive & Transportation, Building & Construction and Others in Metric Tons ............................................ 538 Click here to buy the report Page 11
Global Fluoropolymers Market – Products, Technologies and Applications June 2016 |588 Pages | 408 Charts | Price $5760 Chart 369: Glance at 2012, 2017 and 2022 Rest of Asia- Pacific Fluoropolymers Volume Market Share (%) by End- use Sector – Chemical Processing, Electrical & Electronics, Mechanical/Industrial, Automotive & Transportation, Building & Construction and Others .............................. 539 Value Analysis ........................................................ 540 Chart 370: Rest of Asia-Pacific Fluoropolymers Market Analysis (2012-2022) by End-use Sector – Chemical Processing, Electrical & Electronics, Mechanical/Industrial, Automotive & Transportation, Building & Construction and Others in USD Million ............................................. 540 Chart 371: Glance at 2012, 2017 and 2022 Rest of Asia- Pacific Fluoropolymers Value Market Share (%) by End-use Sector – Chemical Processing, Electrical & Electronics, Mechanical/Industrial, Automotive & Transportation, Building & Construction and Others .............................. 541 4. REST OF WORLD ............................................. 542 Chart 372: Rest of World Fluoropolymers Market Analysis (2012- 2022) in Volume (Metric Tons) and Value (USD Million) ............... 542 4.1 Market Overview by Fluoropolymer Type ....... 543 Volume Analysis ..................................................... 543 Chart 373: Rest of World Fluoropolymers Market Analysis (2012-2022) by Fluoropolymer Type – PTFE, FEP, PVDF, ETFE and PFA in Metric Tons ......................................... 543 Chart 374: Glance at 2012, 2017 and 2022 Rest of World Fluoropolymers Volume Market Share (%) by Fluoropolymer Type – PTFE, FEP, PVDF, ETFE and PFA .. 544 Value Analysis ........................................................ 545 Chart 375: Rest of World Fluoropolymers Market Analysis (2012-2022) by Fluoropolymer Type – PTFE, FEP, PVDF, ETFE and PFA in USD Million .......................................... 545 Chart 376: Glance at 2012, 2017 and 2022 Rest of World Fluoropolymers Value Market Share (%) by Fluoropolymer Type – PTFE, FEP, PVDF, ETFE and PFA .......................... 546 4.2 Market Overview by End-use Sector ................ 547 Volume Analysis ..................................................... 547 Chart 377: Rest of World Fluoropolymers Market Analysis (2012-2022) by End-use Sector – Chemical Processing, Electrical & Electronics, Mechanical/Industrial, Automotive & Transportation, Building & Construction and Others in Metric Tons ............................................. 547 Chart 378: Glance at 2012, 2017 and 2022 Rest of World Fluoropolymers Volume Market Share (%) by End-use Sector – Chemical Processing, Electrical & Electronics, Mechanical/Industrial, Automotive & Transportation, Building & Construction and Others .............................. 548 Value Analysis ........................................................ 549 Chart 379: Rest of World Fluoropolymers Market Analysis (2012-2022) by End-use Sector – Chemical Processing, Electrical & Electronics, Mechanical/Industrial, Automotive & Transportation, Building & Construction and Others in USD Million ............................................. 549 Chart 380: Glance at 2012, 2017 and 2022 Rest of World Fluoropolymers Value Market Share (%) by End-use Sector – Chemical Processing, Electrical & Electronics, Mechanical/Industrial, Automotive & Transportation, Building & Construction and Others .................................. 550 4.2.1 Fluoropolymers Type Market Overview by End- use Sector .............................................................. 551 4.2.1.1 Polytetrafluoroethylene (PTFE) .................. 551 Chart 381: Rest of World Polytetrafluoroethylene (PTFE) Market Analysis (2012, 2016 and 2022) by End-use Sector – Chemical Processing, Electrical & Electronics, Mechanical/Industrial, Automotive & Transportation, Building & Construction and Others in Metric Tons ......... 551 Chart 382: Rest of World Polytetrafluoroethylene (PTFE) Market Analysis (2012, 2016 and 2022) by End-use Sector – Chemical Processing, Electrical & Electronics, Mechanical/Industrial, Automotive & Transportation, Building & Construction and Others in USD Million .......... 552 4.2.1.2 Fluorinated Ethylene Propylene (FEP)........ 553 Chart 383: Rest of World Fluorinated Ethylene Propylene (FEP) Market Analysis (2012, 2016 and 2022) by End-use Sector – Chemical Processing, Electrical & Electronics, Mechanical/Industrial and Others in Metric Tons ......... 553 Chart 384: Rest of World Fluorinated Ethylene Propylene (FEP) Market Analysis (2012, 2016 and 2022) by End-use Sector – Chemical Processing, Electrical & Electronics, Mechanical/Industrial and Others in USD Million ......... 554 4.2.1.3 Polyvinylidene Fluoride (PVDF) .................. 555 Chart 385: Rest of World Polyvinylidene Fluoride (PVDF) Market Analysis (2012, 2016 and 2022) by End-use Sector – Chemical Processing, Electrical & Electronics, Mechanical/Industrial, Building & Construction and Others in Metric Tons .................. 555 Chart 386: Rest of World Polyvinylidene Fluoride (PVDF) Market Analysis (2012, 2016 and 2022) by End-use Sector – Chemical Processing, Electrical & Electronics, Mechanical/Industrial, Building & Construction and Others in USD Million .................................................................... 556 4.2.1.4 Ethylene Tetrafluoroethylene (ETFE) ......... 557 Chart 387: Rest of World Ethylene Tetrafluoroethylene (ETFE) Market Analysis (2012, 2016 and 2022) by End-use Sector – Chemical Processing, Electrical & Electronics and Others in Metric Tons ................................................... 557 Chart 388: Rest of World Ethylene Tetrafluoroethylene (ETFE) Market Analysis (2012, 2016 and 2022) by End-use Sector – Chemical Processing, Electrical & Electronics and Others in USD Million .................................................... 558 4.3 Rest of World Fluoropolymers Market Overview by Geographic Region ............................................ 559 Volume Analysis..................................................... 559 Chart 389: Rest of World Fluoropolymers Market Analysis (2012-2022) by Region – South America and Middle East & Africa in Metric Tons ..................................................... 559 Chart 390: Glance at 2012, 2017 and 2022 Rest of World Fluoropolymers Volume Market Share (%) by Region – South America and Middle East & Africa....................... 560 Value Analysis ........................................................ 561 Chart 391: Rest of World Fluoropolymers Market Analysis (2012-2022) by Region – South America and Middle East & Africa in USD Million ..................................................... 561 Chart 392: Glance at 2012, 2017 and 2022 Rest of World Fluoropolymers Value Market Share (%) by Region – South America and Middle East & Africa ................................. 562 4.3.1 South America ........................................... 563 4.3.1.1 South American Fluoropolymers Market Overview by Fluoropolymer Type .......................... 563 Volume Analysis..................................................... 563 Chart 393: South American Fluoropolymers Market Analysis (2012-2022) by Fluoropolymer Type – PTFE, FEP, PVDF, ETFE and PFA in Metric Tons ............................... 563 Chart 394: Glance at 2012, 2017 and 2022 South American Fluoropolymers Volume Market Share (%) by Fluoropolymer Type – PTFE, FEP, PVDF, ETFE and PFA .. 564 Value Analysis ........................................................ 565 Chart 395: South American Fluoropolymers Market Analysis (2012-2022) by Fluoropolymer Type – PTFE, FEP, PVDF, ETFE and PFA in USD Million ............................... 565 Chart 396: Glance at 2012, 2017 and 2022 South American Fluoropolymers Value Market Share (%) by Fluoropolymer Type – PTFE, FEP, PVDF, ETFE and PFA .......................... 566 4.3.1.2 South American Fluoropolymers Market Overview by End-use Sector .................................. 567 Volume Analysis..................................................... 567 Chart 397: South American Fluoropolymers Market Analysis (2012-2022) by End-use Sector – Chemical Processing, Electrical & Electronics, Mechanical/Industrial, Automotive & Transportation, Building & Construction and Others in Metric Tons ............................................ 567 Chart 398: Glance at 2012, 2017 and 2022 South American Fluoropolymers Volume Market Share (%) by End-use Sector – Chemical Processing, Electrical & Electronics, Mechanical/Industrial, Automotive & Transportation, Building & Construction and Others ............................. 568 Value Analysis ........................................................ 569 Chart 399: South American Fluoropolymers Market Analysis (2012-2022) by End-use Sector – Chemical Processing, Electrical & Electronics, Mechanical/Industrial, Automotive & Transportation, Building & Construction and Others in USD Million ............................................ 569 Chart 400: Glance at 2012, 2017 and 2022 South American Fluoropolymers Value Market Share (%) by End-use Sector – Chemical Processing, Electrical & Electronics, Mechanical/Industrial, Automotive & Transportation, Building & Construction and Others .................................. 570 4.3.2 Middle East & Africa ................................... 571 4.3.2.1 Middle East & Africa Fluoropolymers Market Overview by Fluoropolymer Type .......................... 571 Volume Analysis .................................................... 571 Chart 401: Middle East & Africa Fluoropolymers Market Analysis (2012-2022) by Fluoropolymer Type – PTFE, FEP, PVDF, ETFE and PFA in Metric Tons .............................. 571 Chart 402: Glance at 2012, 2017 and 2022 Middle East & Africa Fluoropolymers Volume Market Share (%) by Fluoropolymer Type – PTFE, FEP, PVDF, ETFE and PFA . 572 Value Analysis ........................................................ 573 Chart 403: Middle East & Africa Fluoropolymers Market Analysis (2012-2022) by Fluoropolymer Type – PTFE, FEP, PVDF, ETFE and PFA in USD Million .............................. 573 Chart 404: Glance at 2012, 2017 and 2022 Middle East & Africa Fluoropolymers Value Market Share (%) by Fluoropolymer Type – PTFE, FEP, PVDF, ETFE and PFA . 574 4.3.2.2 Middle East & Africa Fluoropolymers Market Overview by End-use Sector .................................. 575 Volume Analysis .................................................... 575 Chart 405: Middle East & Africa Fluoropolymers Market Analysis (2012-2022) by End-use Sector – Chemical Processing, Electrical & Electronics, Mechanical/Industrial, Automotive & Transportation, Building & Construction and Others in Metric Tons ............................................ 575 Chart 406: Glance at 2012, 2017 and 2022 Middle East & Africa Fluoropolymers Volume Market Share (%) by End- use Sector – Chemical Processing, Electrical & Electronics, Mechanical/Industrial, Automotive & Transportation, Building & Construction and Others ............................. 576 Value Analysis ........................................................ 577 Chart 407: Middle East & Africa Fluoropolymers Market Analysis (2012-2022) by End-use Sector – Chemical Processing, Electrical & Electronics, Mechanical/Industrial, Automotive & Transportation, Building & Construction and Others in USD Million ............................................ 577 Chart 408: Glance at 2012, 2017 and 2022 Middle East & Africa Fluoropolymers Value Market Share (%) by End-use Sector – Chemical Processing, Electrical & Electronics, Mechanical/Industrial, Automotive & Transportation, Building & Construction and Others ............................. 578 PART C: GUIDE TO THE INDUSTRY ............... 579 1. Fluoropolymer Resin Manufacturers ............... 579 2. Fluoropolymer Processors & Compounders ..... 581 PART D: ANNEXURE .................................... 587 1. RESEARCH METHODOLOGY ............................. 587 2. FEEDBACK ....................................................... 589 Click here to buy the report Page 12
Global Fluoropolymers Market – Products, Technologies and Applications June 2016 |588 Pages | 408 Charts | Price $5760 Comprehensive Reports on Individual Fluoropolymer Products Polyvinylidene Fluoride (PVDF) – A Global Market Overview The remarkable properties and versatility of PVDF resins have made them an indispensable component in a wide array of application areas. Global volume consumption of Polyvinylidene Fluoride (PVDF), standing at 35.5 thousand metric tons in 2012, is forecast to be 46.1 thousand metric tons in 2016 and projected to reach 69.2 thousand metric tons by 2022 at a CAGR of 7% between 2016 and 2022. Over the same period, global value demand for PVDF is likely to post a faster CAGR of 7.5% and reach a projected US$1.4 billion by 2022 from a forecast US$899.5 million in 2016. Published: Jun 2016 - Report Code: CP047 - Price: $4500 .......................................................................................................... View Report Fluorinated Ethylene Propylene (FEP) – A Global Market Overview Global demand for fluoropolymers has been witnessing considerable growth and as major worldwide economies are on the path to recovery, the need for specialty, melt-processable grades such as Fluorinated Ethylene Propylene (FEP) has also been growing rapidly. This polymer is finding extensive use in areas such as wire and cable, photovoltaic (PV), aerospace and automotive markets. Published: Apr 2016 - Report Code: CP046 - Price: $3600 .......................................................................................................... View Report Polytetrafluoroethylene (PTFE) – A Global Market Overview PTFE‘s vast potential applications in developing world such as China, India, Russia and other emerging countries is a key opportunity for PTFE manufacturers, that would be converted into market demand by new product and application development. Increasing use of novel products like modified PTFE and expanded PTFE in applications such as chemical processing, electrical & electronics, medical devices and filtration is set to increase the global demand for PTFE in the coming years. Micronized PTFE is estimated to be the fastest growing product form owing to.... Published: Apr 2016 - Report Code: CP045 - Price: $4500 .......................................................................................................... View Report About Industry Experts Industry Experts values the most updated and accurate market research and industry analysis to provide unique market research reports for a broad range of industry verticals including Automotive, Transportation, Healthcare, Pharmaceuticals, Food & Beverages, Chemicals, Plastics, Materials, Consumer Goods, Retail, Biotechnology, Construction, Manufacturing and Other industries. Our research reports help our clients to identify and resolve topical issues by providing a complete picture of the market in their respective industry sectors. The Company’s rich collection of market research reports enable the companies to explore market drivers; forecast the future market; and to formulate the right strategies at the right time. INDUSTRY EXPERTS 1-7-19/C, Street No. 8, Habsiguda Hyderabad – 500007, India Phone: +91-40-4018-1314 Fax: +91-40-4027-2381 info@industry-experts.com industry-experts.com Industry Experts’ leading edge publications makes the life easy for corporate strategists, investors, analysts and researchers, start ups, consultants, financial and banking executives, academicians and many more. The company also provides customized research reports to cater the needs of the industry. More about Industry Experts Click here to buy the report Page 13