Download
1 / 25
250 likes | 412 Vues
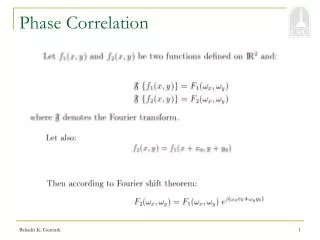
EE 5359 Project-Pattern Recognition Diagnostic using Phase Only Correlation technique submitted by Thejaswini Purushotham 1000616811. Fig. 1 Experimental setup for medical image diagnostics. What has been done already?. A fingerprint matching algorithm using phase only correlation [1].

E N D
EE 5359 Project-Pattern Recognition Diagnostic using Phase Only Correlation technique submitted byThejaswini Purushotham1000616811
What has been done already? • A fingerprint matching algorithm using phase only correlation [1]. • The proposed technique is particularly effective for verifying low-quality fingerprint images that could not be identified correctly by conventional techniques.
Applications • Automated detection of osteoarthritis from knee-xray. • Microcalcification clusters in mammograms. Emphysema in CT-a lung pathology characterised by destruction of lung. • lung nodule detection from postero-anterior chest radiographs. • Cryo-electron microscopy: in structural biology is one of the fields which requires fully automated object detection techniques.
Simulation Results Fig2:Correlation graph for two similar images length of the peak=1
Results for illumination invariance fig 5:(a) and (b) are the X-ray images of the same chest with variation in illumination.
Application of POC for pulmonary emphysema detection. • There are 80 million patents with developed pulmonary emphysema all over the world • 3 million patients are dying every year • Studies have shown that lung tissue is about a third of the lung volume has to be destructed before emphysema could be detected[11]. • Doctors have two methods to diagnose pulmonary emphysema.One of the methods is spirometry, another is diagnostic imaging. Former is a quantitative method, however, we cannot make an early detection of the disease .
The classical method of CT image objective evaluation is the PI (pixel index) method. • Emphysema shows up on CT as areas with low attenuation coefficients, with abnormal distribution . • By determining the number of pixels with low attenuation, emphysema can be detected . • . PI determines the average number of pixels with lower attenuation than the limit value(lim).
Fig.9: Subject A, normal lung. These images show homogeneous distribution of air in the lung. The white dots represent areas with lower attenuation values than 950 HU, 930 HU, and 910 HU, respectively. The calculated percentages are: 3%, 5%, and 10%.[13]
Fig.10: Subject C, severe emphysema. There is an obvious destruction ofthe lung parenchyma. Pixel indexes:34%,48% and 62%.[13]
Issues with PI method • The PI method is a good, well-known measure of emphysema. But it is not able to detect emphysema in cases in which emphysema and fibrosis occur at the same time. • This is because fibrosis tends to increase the attenuation co-efficient of pixels whereas emphysema tends to reduce the attenuation co-efficient of pixels. • To reduce the health risk from exposure to radiation while making a CT scan, it is desirable to use a radiation dose that is as low as possible. • . However, the constraint on irradiation dose leads to considerable noise in CT scans. • Radiation dosages directly influence the PI index.
Fig.11: Coronal slice and its accompanying emphysema map calculated for a threshold of 930 HU. (a),(b) Scan with clinical radiation dose (PI =13.3%).(c),(d) Approximately corresponding slice of a scan of the same patient with a ten times lower radiation dose (PI=15.8%)
Fig.12 : (1a),(1b),(1c)Simulation results for emphysema detection
Fig.123: Simulation results for emphysema progression.(4a) is the image of a healthy individual.(4b),(4c)and(4d) are images of the emphysema in different progressive stages.(4e) shows that there 11.7% difference between (4a) and (4b). (4f) shows that there is .58% difference between (4b)and (4c). (4g) shows that there is .02% change between (4c) and (4d)
POC method gives a direct mapping between the number of affected pixels and the percentage of visible pixels on the POC map. • POC method scores over the traditional PI method in terms of the Radiation dosage. • PI method gives better performance at higher dosages of radiation. But the POC method is not dependant on the brightness of the image. • Hence it is a better method compared to the PI method. • This technique can be extended and verified over other pathologies like osteoarthritis, Lung Nodule Detection and Microcalcification clusters in mammograms.
References [1]Fazl-e-Basit, M.Y. Javed and U. Qayyum,“Face Recognition Using Processed Histogram And Phase-Only Correlation(POC)”, International Conference on Emerging Technologies, ICET 2007, pp 238-242, Nov.2007. [2]C.Nakajima et al, “Object Recognition And Detection By a Combination Of Support Vector Machine And Rotation Invariant Phase Only Correlation“. 15th International Conference on Pattern Recognition, IEEE Proc,Vol.4, pp 787-790,Sept.2000. [3]J. Z. Wang et al, "Investigation Of A Phase-Only Correlation Technique For Anatomical Alignment Of Portal Images In Radiation Therapy", Phys. Med. Biol. Vol.41,pp 1045-1058 ,Jun.1996. [4]H.Nakajima et al, “A Fingerprint Matching Algorithm Using Phase Only Correlation“. IEICE Trans. Fundamentals, Vol.87-A,pp 682-691,Mar.2004. [5]S.Watanabe,T.Tanaka and E.Iwata, “Biometric Authentication Using Phase Only Correlation With Compensation Algorithm For Rotation.” SICE-ICASE, International Joint Conference ,Vol.18, pp 3711-3715, Oct.2006. [6]G.Yang, X.YU,X.Zhuanq, “Current Status And Development Of Pattern Recognition Diagnostic Methods Based On Medical Imaging”. IEEE International conference on Networking, Sensing and Control, Vol.10,pp 567-572,Apr.2008. [7]V.Zarzoso and A.K.Nandi, “Comparison Between Blind Separation And Adaptive Noise Cancellation Techniques For Fetal Electrocardiogram Extraction,” in Proc.IEE Colloquium on Medial Applications of Signal Processing, Vol 48,pp 12-18,Oct.1999. [8]Z.Y.Qian et al,” Medical Images Edge Detection Based on Mathematical Morphology,” Proc. Of IEEE, Engineeing in Medicine and Biology 27th Annual Conference, pp 6492-6495,Jan.2006. [9] WHO Fact sheet website,http://www.who.int/mediacentre/factsheets/fs315/en/index.html [10] R.Kobayashi et al,”Algorithm of Pulmonary emphysema analysis using comparing with expiratory and inspiratory state of CT images”, SICE Annual Conference 2008, pp 3105-3109, Aug. 2008.
[11] R. Uppaluri, et al “Quantification of pulmonary emphysema from lung computed tomography images,” Respir. Crit. Care Med., vol. 156, pp. 248–254, 1997. [12] Health information website, http://copd.emedtv.com/emphysema/stages-of-emphysema-p2.html [13] R.A.Blechschmidt, R.Werthschutzky and U.LOrcher,”Automated CT image evaluation of the lung: A morphology-based concept”,IEEE transactions on medical imaging. [14] A. Madani, C. Keyzer, and P. Gevenois, “Quantitative computed tomography assessment of lung structure and function in pulmonary emphysema,”Eur. Respir. J., vol. 18, no. 4, pp. 720–730, 2001. [15] U. Tylén, O. Friman, M. Borga, and J.-E. Angelhed, “An improved algorithm for computerized detection and quantification of pulmonary emphysema at high resolution computed tomography (hrct),” Proc. SPIE, vol. 4321, pp. 254–262, 2001. [16] W. J. Kostis, S. C. Fluture, D. F. Yankelevitz, and C. I. Henschke, “Method for analysis and display of distribution of emphysema in CT scans,” Proc. SPIE (Medical Imaging), vol. 5032, pp. 199–206, 2003. [17] Muller, Staples, Miller, Abboud: Density mask: An objective method to quantitate emphysema using computed tomography. Chest 94 (1988) 782–787. [18] O. Amir, D. Braunstein, and A. Altman, “Dose optimization tool,” Proc.SPIE (Visualization, Image-Guided Procedures, and Display), vol. 5029,pp. 815–821, 2003.
ACRONYMS • 2 D 2 Dimension • DFT Discrete Fourier Transform • IDFT Inverse Fast Fourier Transform • FFT Fast Fourier Transform • POC Phase Only Correlation • PGM Portable Gray Map