Download
1 / 69
1.01k likes | 1.67k Vues
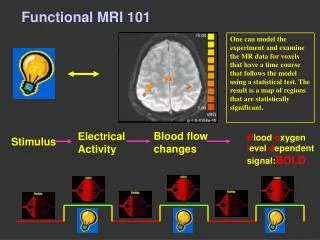
Functional MRI. Daniel Bulte. Centre for Functional Magnetic Resonance Imaging of the Brain University of Oxford. Overview. BOLD Contrast Metabolic and cerebral blood flow response Mechanism of MR signal change Neurovascular coupling Noise Factors affecting BOLD More detail

E N D
Functional MRI Daniel Bulte Centre for Functional Magnetic Resonance Imaging of the Brain University of Oxford
Overview • BOLD Contrast • Metabolic and cerebral blood flow response • Mechanism of MR signal change • Neurovascular coupling • Noise • Factors affecting BOLD • More detail • Changing physiological baseline • Metabolic modelling
Deoxy-Haemoglobin paramagnetic different to tissue =0.08ppm
Oxy-Haemoglobin diamagnetic same as tissue
Field homogeneity & oxygenation state • Red blood cell • 6 m diameter, 1-2 m thick • Susceptibility • An object with differing magnetic properties distorts the field
Water • Freely diffusing water is the source of image signal • Two water spaces • Intravascular (blood) • Capillaries and venules • Extravascular - a larger pool • In 50ms (FMRI TE) water diffuses 4 capillary diameters
Magnetic field in a vessel B0 q a r Inside Cylinder f ∆cos2 = 2(1-Y) ' D w '
Magnetic field around a vessel B0 Outside Cylinder q r, sin2a/r2cos a r Inside Cylinder f ∆cos2 = 2(1-Y) ' D w '
Vessel orientation • Field inside and outside depends on angle with respect to B0 Bandettini and Wong. Int. J. Imaging Systems and Technology. 6:133 (1995)
Blood oxygenation • Field inside and outside depends on Y, oxygenation Bandettini and Wong. Int. J. Imaging Systems and Technology. 6:133 (1995)
Signal dependence • Macroscopic behaviour of NMR, gradient echo signal • More extravascular at high field • BOLD signal depends on the amount of dHb in the voxel R2* = 4.3 (1-Y) B0 CBV (venules, larger vessels) R2* = 0.04 {(1-Y)}2B02 CBV (smaller capillaries)
BOLD signal • Blood Oxygen Level Dependent signal • T2* change from the haemodynamic perturbation associated with neural activation
Neural activity Signalling Vascular response BOLD signal Vascular tone (reactivity) Autoregulation Blood flow, oxygenation and volume Synaptic signalling arteriole B0 field glia Metabolic signalling venule From neural activity to BOLD signal
Factors affecting BOLD signal? • Physiology • Cerebral blood flow (baseline and change) • Metabolic oxygen consumption • Cerebral blood volume • Equipment • Static field strength • Field homogeneity (e.g. shim dependent T2*) • Pulse sequence • Gradient vs spin echo • Echo time, repeat time, flip angle • Resolution
T2* weighted signal T2* weighted signal T2* weighted signal T2* weighted signal T2* weighted signal T2* weighted signal T2* weighted signal T2* weighted signal T2* weighted signal T2* weighted signal T2* weighted signal Oxygen Consumption Neural Activity Neural Activity Oxygen Consumption Neural Activity Oxygen Consumption Neural Activity Oxygen Consumption Neural Activity Neural Activity Neural Activity Oxygen Consumption Neural Activity Neural Activity Oxygen Consumption Oxygen Consumption Neural Activity Neural Activity Oxygen Consumption Oxygen Consumption Oxygen Consumption Oxygen Consumption Image Image Image Image Image Image Image Image Image Image Image Blood Flow Blood Flow Blood Volume Blood Flow Blood Volume Blood Flow Blood Flow Blood Volume Blood Flow Blood Flow Blood Volume Blood Volume Blood Volume Blood Volume Oxy- haemoglobin Oxy- haemoglobin Oxy- haemoglobin Oxy- haemoglobin Oxy- haemoglobin Oxy- haemoglobin Oxy- haemoglobin Oxy- haemoglobin Oxy- haemoglobin Oxy- haemoglobin Oxy- haemoglobin Deoxy- haemoglobin Deoxy- haemoglobin Deoxy- haemoglobin Deoxy- haemoglobin Deoxy- haemoglobin Deoxy- haemoglobin Deoxy- haemoglobin Deoxy- haemoglobin Deoxy- haemoglobin Deoxy- haemoglobin Deoxy- haemoglobin
Haemodynamic changes underlying BOLD CBF positive BOLD response 3 initial dip BOLD response, % post stimulus undershoot 2 overshoot CBV 1 0 time CMRO2 stimulus stimulus
BOLD contrast • Transverse relaxation • Described by a time constant • Time for NMR signal to decay • Loss of spins phase coherence (out of step) • Spin echo, T2 • Time varying field seen by diffusing spins • Gradient echo, T2* • Time varying field seen by diffusing spins • … plus spatial field variation across voxel • Why is magnetic field non uniform?
Modelling of the BOLD effect • Effects of oxygenation on T2* • Ogawa et al., J. Biophys., 64:803-812 (1993) • Kennan et al., MRM, 31:9-21 (1994) • Boxerman et al., MRM, 34:4-10 (1995) • Flow and oxygenation coupling • Buxton and Frank, JCBFM, 17:64-72 (1997) • CBV effects • Buxton et al., MRM, 39:855-864 (1998) • Mandeville et al., JCBFM, 19:679-689 (1999)
Signal evolution • Monte Carlo simulation • Signal dephasing in the vascular tree amongst vessels of differing size, oxygenation and orientation • Boxerman J. et al. MRM 1995 • Deoxy-Hb contribution to relaxation • Gradient echo R2* (1-Y) CBV Y=O2 saturation b~1.5 S = Smax . e-TE/R2*
Echo time and BOLD sensitivity • BOLD contrast-to-noise optimised when TE~T2* • T2* shorter at higher field Relative CNR TE optimization similar to T2 structural optimizations, just between different states rather than different tissues TE (ms)
Vessel density 500 m 100 m Harrison RV et al. Cerebral cortex. 2002
Arteriole 100 m
Even smaller 50 m
Arterial side Capillaries 8 m 40% CBV • Capillaries are randomly orientated • Oxygen exchange in capillaries • Arterioles perform local CBF control Arterioles 25 m 15% of CBV Artery Blood oxygen saturation, 98-100%
Venous side Capillaries • Venules • are (approx) randomly orientated • have the same blood volume as capillaries • have twice the deoxyHb concentration of capillaries • are more (para)magnetic than capillaries and arteries Venules 25-50 m 40% of CBV Vein Blood oxygen saturation (resting), 60%
Activation O2 Sat 100% 80% 60% Rest • Active: 50% increase in CBF, 20% increase in CMRO2 • O2 Sat 100% 86% 72%
electrical activity hemodynamic response x x x x x x x x x x x x x x x x x x x x x x x x x x x x x x x x x x x x x x x x x x BOLD FMRI Basal (resting) state MRI signal capillary bed capillary bed - normal flow - basal level [Hbr] - basal CBV - normal MRI signal arterioles arterioles venules venules CBV FLOW = HbO2 = HbO2 Field gradients = Hbr = Hbr
electrical activity hemodynamic response x x x x x x x x x x x x x x x x x x x x x x x x x x x x x x x x x x x x x x x x x x BOLD FMRI Activated state MRI signal capillary bed capillary bed arterioles arterioles - increased flow - decreased [Hbr] - increased CBV - increased MRI signal venules venules CBV CBV FLOW FLOW = HbO2 = HbO2 = Hbr = Hbr
Dissecting BOLD • SBOLD=f(CBV,CBF,CMRO2) Purer measures of neuronal activity? Buxton et al. Neuroimage 2004
FMRI Modelling: TheHaemodynamic Response • The stimulus is convolved with an assumed or modeled impulse response function, the haemodynamic response function (HRF), to give the assumed BOLD response
HRF Stimulus (Single Event) Haemodynamic Response Function (HRF) Time 0 10 20 30 seconds The haemodynamic response to a stimulus is blurred and delayed
Predicted Response • The process can be modeled by convolving the activity curve with the HRF HRF Predicted neural activity = Predicted response
GLM • Standard GLM Analysis: • Correlate model at each voxel separately • Measure residual noise variance • T-statistic = model fit / noise amplitude • Threshold T-stats and display map • Signals of no interest (e.g. artifacts) can affect both activation strength and residual noise variance • Use pre-processing to reduce/eliminate some of these effects
A typical scan at 3T… • Gradient echo EPI • TR 2000 – 4000 ms • TE 30 ms • Flip angle 60 – 90 degrees • 64 x 64 • 4 – 8 mm thick slices • 20 – 40 slices
Why EPI? • A typical T2-weighted imaging series requires that TR be two to three times longer than the intrinsic tissue magnetization parameter, T1. • The T1 of biological samples is typically on the order of a second; TR must therefore be 3 seconds or more. • A typical MR image is formed from 128 repeated samples, so that the imaging time for our canonical T2 weighted scan is about 384 seconds, or more than 6.5 minutes. • By comparison, the EPI approach collects all of the image data, for an image of the same resolution, in 40 to 150 milliseconds • A nearly 10,000-fold speed gain!
However… • Bandwidth and Artifacts • Chemical Shift • Shape Distortion • Ghosting • Resolution
Purer physiological measures • Perfusion and perfusion change • CMRO2 change • Cerebral blood volume • Oxygen extraction fraction
neuronal activity FDG PET - excitatory autoradiography - inhibitory - soma action potential H215O PET NIRS Neurovascular coupling optical imaging EEG FMRI MEG Correlates of brain activity electrophysiology metabolic response - glucose consumption - oxygen consumption hemodynamic response - blood flow - blood volume - blood oxygenation
Oxidative metabolism attenuates BOLD signal BOLD CBF • Hoge R et al
CMRO2 measurement Measured BOLD R2*(BOLD) = k CBVa [dHb]b • k = field dependent constant • CBV = cerebral blood volume fraction • [dHb] = concentration of dHb in blood • = theoretical CBV dependence (=1) • = theoretical [dHb] dependence • 1.5 (1.5T) [Boxerman et al, 1995] • 1 (>3T) [Ogawa et al, 1993]
CMRO2 measurement Substitutions: CMRO2 = CBF. OEF . Ca (Fick’s principle) [dHb] = CMRO2 / CBF CBV CBF ) ( (Grubb et al., 1974) = CBV0 CBF0 = 0.38 (steady state value) ASL measured
CMRO2 DR2*(BOLD) CBF ] -b ) ( ) ( b = 1 - CBF0 R2*0(BOLD) CMRO2(0) CMRO2 measurement A flow increase without increase in CMRO2 Calibrate R2*0 using a hypercapnia challenge
Calibrated BOLD for measuring CMRO2 CMRO2-CBF coupling: slope ~2 Calibrated BOLD • Hoge R et al
What else? • ASL • VASO • MRS • DWI • ???
CBV BOLD Neural Response CBF Neurovascular Coupling CMRO2 Stimulus
movement of blood water: measure of CBF Arterial Spin Labeling Relies on endogenous contrast agent Magnetically label water at the neck (below imaging plane) Labeled blood moves downstream and mixes with stationary tissue water CBF (ml g-1 min-1) pCO2 (mmHg) Williams et al. PNAS 1992
Wait for tag blood water spins to arrive tag delay: 500 - 2000 msec image ASL: Tagging Strategies Universal concept: “tag” and “control” tag time
ASL: Tagging Strategies Universal concept: “tag” and “control” no tag image Wait the same amount of time but no tagging