Download
1 / 84
1.04k likes | 1.49k Vues
LABORATORY MANAGEMENT and QUALITY ASSURANCE. Introduction.

E N D
Introduction “The analytical laboratory provides qualitative and quantitative data for use in decision-making. To be valuable, the data must accurately describe the characteristics and concentrations of constituents in the samples submitted to the laboratory. In many cases, because they lead to faulty interpretations, approximate or incorrect results are worse than no result at all.” • HANDBOOK FOR ANALYTICAL QUALITY CONTROL IN WATER AND WASTEWATER LABORATORIES, EPA 1979
Quality Assurance - Defined “Quality Assurance (QA) is a set of operating principles that, if strictly followed during sample collection and analysis, will produce data of known and defensible quality.” “The Accuracy of the analytical result can be stated with a high level of confidence.” • STANDARD METHODS, 18th EDITION, 1992
Outline • Laboratory Management • Introduction to Quality Assurance Concepts
Laboratory Management • Who should be involved in laboratory management and quality assurance?
Laboratory Management • Everyone involved with the lab: • Person sampling • Person running the test • Person washing the glassware • Person doing maintenance on the instruments • Person interpreting the results
Laboratory Management • Quality Assurance Program • Staff Organization and Responsibilities • Sample Control and Documentation • SOP for Analytical Methods & Procedures • Analyst Training Requirements • Equipment Preventative Maintenance • Calibration Procedures • Corrective Actions • Internal Quality Control Activities • Performance Audits • Data Assessment for Bias and Precision • Data Validation and Reporting
Laboratory Management • Keys to Quality Assurance Program: • Documentation • Communication • Training • Cross-Training • Updating
Sample Control and Documentation • A record keeping system (paper trail, chain of custody) should track samples before, during, and after analysis. • Everyone involved needs to understand and utilize the system.
Sample Control and Documentation • Efficiently process information through lab system while minimizing actual time spent recording data • Keep it simple! • Collect only the information you need
Suggested Information - Field Hayfield Site Influent Site Date 04-15-02 8am HS IN 1 Collected By Jim S. Code Conditions Sunny, 75F Comments: pH adjusted to <2 with nitric acid Grab sample
Suggested Information - Lab • Date of analysis • Laboratory technicians performing the analysis • Results (including units) • Analytical comments: based on need to know • Dilutions • Interferences encountered
SOP for Analytical Procedures • Describes method in enough detail that an experienced analyst could obtain acceptable results.
SOP for Cleanliness • Labware cleaning procedures should be documented and all persons involved should be trained.
Routine Cleaning Procedure • Rinse glassware with tap water. • Clean glassware with a solution of water and laboratory detergent. • Rinse the glassware with an acidic solution • 1.0 N HCl • 6N HNO3 for regulatory reporting of heavy metals • Rinse glassware at least 3X with DI water.
Routine Cleaning Procedure (cont.) • Glassware should be stored in a manner that prevents contamination from dust particles. • Prior to analysis, rinse the glassware with sample to prevent contamination or dilution.
SOP for Instrumentation Maintenance • Preventative maintenance is the key to optimal instrument performance. • Follow any maintenance program and guidelines suggested by the instrument manufacturer. • Instrument manual • Reduces instrument downtime • Service Contracts with Manufacturers
Analyst Training • Sample Logging and Preservation • Method SOPs • Measuring • Use of Volumetric glassware (pipettes, graduated glassware) • Weighing / Use and care of Analytical Balance • Washing and Care of Glassware • Operation of Analytical Instrumentation • Data Handling and Reporting • Quality Control Activities • Safety
Quality Assurance Quality Control Quality Assessment Performance Evaluation Samples Performance Audits • Certification of Analyst Competence • Recovery of Known Additions • Analysis of Standards • Analysis of Reagent Blanks • Calibration with Standards • Analysis of Duplicates • Maintenance of Control Charts
Quality Assurance Quality Control Quality Assessment Performance Evaluation Samples Performance Audits • Certification of Analyst Competence • Recovery of Known Additions • Analysis of Standards • Analysis of Reagent Blanks • Calibration with Standards • Analysis of Duplicates • Maintenance of Control Charts
Certification of Analyst Competence • Demonstration of acceptable precision and accuracy for each analyst • Minimum of four replicate analyses on a known standard • Look for acceptable accuracy and precision • Acceptable limits vary per analytical method • ‘Demonstration of Capability’
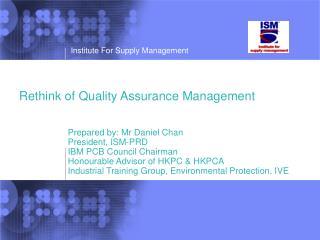
What is Accuracy? • Accuracy is the nearness of a test result to the true value.
What is Precision? • Precision is how closely repeated measurements agree with each other. • Although good precision suggests good accuracy, precise results can be inaccurate.
Imprecise and inaccurate Accurate but imprecise Precise but inaccurate Precise and accurate
Quality Assurance Quality Control Quality Assessment Performance Evaluation Samples Performance Audits • Certification of Analyst Competence • Recovery of Known Additions • Analysis of Standards • Analysis of Reagent Blanks • Calibration with Standards • Analysis of Duplicates • Maintenance of Control Charts
Standards • What is a standard? • Solution containing a known amount of a specific substance • Example – 1.00mg/L iron standard
Standards • How are standards used? • Instrument calibration • Instrument verification/accuracy check • Analyst training
Standards • Analysis of Known Standard Solutions – Am I running the test correctly? • Verifies instrument, technique, and reagents
Standards • Analysis of Known Standard Solutions – • How often? • Daily, every Sample ‘Batch’? • National Institute of Standards and Technology • “NIST”
Standards • Recovery of Known Additions – • Is my sample compatible with the test? • Identifies interferences and percent recovery • Standard Addition • ‘Spiked sample’
= 1.00 mg/L Correct?? 1.20 mg/L 1.39 mg/L 1.58 mg/L 1.20 mg/L 1.40 mg/L 1.60 mg/L 50 mg/L Iron Standard
1.20 mg/L 1.39 mg/L 1.58 mg/L X X X 100 = 100 % 100 = 99 % 100 = 98.7 % 1.20 mg/L 1.40 mg/L 1.60 mg/L
Calibration with Standards • Some instruments have built-in calibration curves, not necessary to calibrate • Instrument without preprogrammed calibration curves • Prepare curve daily - OR • Whenever a new lot of reagents is prepared
Calibrations mg/L ABS
pH Calibration Curve +180 mV 0 -180 4 10 7 pH
Standards • “It’s what I always get” • “It meets the permit limit” • “I did”: • what the manual said • what tech support said • what you told me • “It’s the same number the City of ____ gets” • “I got what I expected” • “I’ve run standards” • “It’s a XXX brand instrument, the best!” • “After 20 years you get a feel for it” • “I’m a chemist” • “It’s the same answer the lab got”
Quality Assurance Quality Control Quality Assessment Performance Evaluation Samples Performance Audits • Certification of Analyst Competence • Recovery of Known Additions • Analysis of Standards • Analysis of Reagent Blanks • Calibration with Standards • Analysis of Duplicates • Maintenance of Control Charts
Reagent Blanks • Some reagents contribute color to a sample • Quantifies amount of reagent contribution to color formation • Monitors of purity of reagents • On each new lot of reagents • 5% of samples (Standard Methods)
Quality Assurance Quality Control Quality Assessment Performance Evaluation Samples Performance Audits • Certification of Analyst Competence • Recovery of Known Additions • Analysis of Standards • Analysis of Reagent Blanks • Calibration with Standards • Analysis of Duplicates • Maintenance of Control Charts
Analysis of Duplicates • Assesses precision • 5% of sample need to be Duplicates • (Standard Methods)
Quality Assurance Quality Control Quality Assessment Performance Evaluation Samples Performance Audits • Certification of Analyst Competence • Recovery of Known Additions • Analysis of Standards • Analysis of Reagent Blanks • Calibration with Standards • Analysis of Duplicates • Maintenance of Control Charts
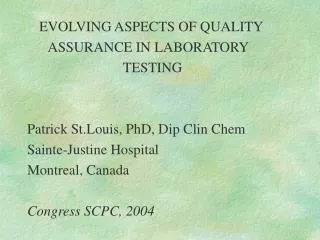
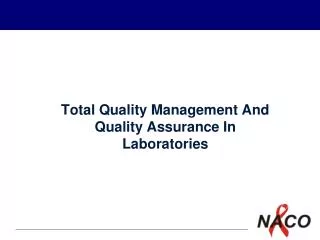
What is a Control Chart? • Quality control (QC) measuring device that visually represents the QC data • Information in a control chart can aid in determining: • Probable source of measurement variability • Whether or not a process is in statistical control
How do Control Charts Work? • If the chart displays other than random variation around the expected result, it suggests a problem with the measurement process. • Control limits are plotted on the chart, to assess whether this has happened. The measurement results are expected to remain within these limits.
Normal Distribution (Standard Deviationaround the Mean) -3s -2s -1s MEAN +1s +2s +3s