Download
1 / 1
10 likes | 104 Vues
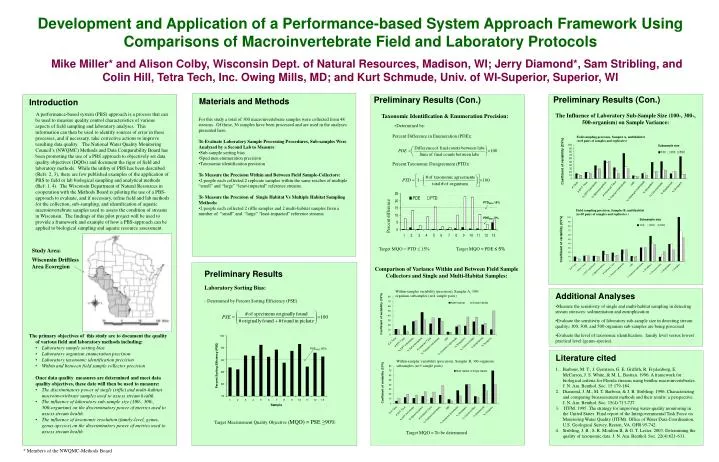
PSE MQO 90%. PTD MQO 15%. Percent difference. PDE MQO 5%. Development and Application of a Performance-based System Approach Framework Using Comparisons of Macroinvertebrate Field and Laboratory Protocols

E N D
PSEMQO 90% PTDMQO 15% Percent difference PDEMQO 5% Development and Application of a Performance-based System Approach Framework Using Comparisons of Macroinvertebrate Field and Laboratory Protocols Mike Miller* and Alison Colby, Wisconsin Dept. of Natural Resources, Madison, WI; Jerry Diamond*, Sam Stribling, and Colin Hill, Tetra Tech, Inc. Owing Mills, MD; and Kurt Schmude, Univ. of WI-Superior, Superior, WI • For this study a total of 300 macroinvertebrate samples were collected from 48 streams. Of these, 36 samples have been processed and are used in the analyses presented here. • To Evaluate Laboratory Sample Processing Procedures, Sub-samples Were Analyzed by a Second Lab to Measure: • Sub-sample sorting bias • Specimen enumeration precision • Taxonomic identification precision • To Measure the Precision Within and Between Field Sample-Collectors: • 2 people each collected 2 replicate samples within the same reaches of multiple “small” and “large” “least-impacted” reference streams. • To Measure the Precision of Single Habitat Vs Multiple Habitat Sampling Methods: • 2 people each collected 2 riffle samples and 2 multi-habitat samples from a number of “small” and “large” “least-impacted” reference streams Preliminary Results (Con.) Preliminary Results (Con.) • A performance-based system (PBS) approach is a process that can be used to measure quality control characteristics of various aspects of field sampling and laboratory analyses. This information can then be used to identify sources of error in these processes, and if necessary, take corrective actions to improve resulting data quality. The National Water Quality Monitoring Council’s (NWQMC) Methods and Data Comparability Board has been promoting the use of a PBS approach to objectively set data quality objectives (DQOs) and document the rigor of field and laboratory methods. While the utility of PBS has been described (Refs: 2, 3), there are few published examples of the application of PBS to field or lab biological sampling and analytical methods (Ref: 1, 4). The Wisconsin Department of Natural Resources in cooperation with the Methods Board is piloting the use of a PBS-approach to evaluate, and if necessary, refine field and lab methods for the collection, sub-sampling, and identification of aquatic macroinvertebrate samples used to assess the condition of streams in Wisconsin. The findings of this pilot project will be used to provide a framework and example of how a PBS-approach can be applied to biological sampling and aquatic resource assessment. • The primary objectives of this study are to document the quality of various field and laboratory methods including: • Laboratory sample sorting bias • Laboratory organism enumeration precision • Laboratory taxonomic identification precision • Within and between field sample collector precision • Once data quality measures are determined and meet data quality objectives, these date will then be used to measure: • The discriminatory power of single (riffle) and multi-habitat macroinvertebrate samples used to assess stream health. • The influence of laboratory sub-sample size (100-, 300-, • 500-organism) on the discriminatory power of metrics used to assess stream health. • The influence of taxonomic resolution (family-level, genus, genus-species) on the discriminatory power of metrics used to assess stream health. Materials and Methods Introduction The Influence of Laboratory Sub-Sample Size (100-, 300-, 500-organism) on Sample Variance: Taxonomic Identification & Enumeration Precision: -Determined by: Percent Difference in Enumeration (PDE): Percent Taxonomic Disagreement (PTD): Field sampling precision, Sampler A, multihabitat (n=8 pairs of samples and replicates) Subsample size Coefficient of variability (CV%) Field sampling precision, Sampler B, multihabitat (n=10 pairs of samples and replicates ) Subsample size Coefficient of variability (CV%) Target MQO = PTD ≤ 15% Target MQO = PDE≤ 5% Study Area: Wisconsin Driftless Area Ecoregion Preliminary Results Laboratory Sorting Bias: - Determined by Percent Sorting Efficiency (PSE) Comparison of Variance Within and Between Field Sample Collectors and Single and Multi-Habitat Samples: • Additional Analyses • Measure the sensitivity of single and multi-habitat sampling in detecting stream stressors: sedimentation and eutrophication • Evaluate the sensitivity of laboratory sub-sample size in detecting stream quality: 100, 300, and 500 organism sub-samples are being processed • Evaluate the level of taxonomic identification: family level versus lowest practical level (genus-species). Within-sampler variability (precision), Sampler A, 300-organism subsamples (n=4 sample pairs) Coefficient of variability (CV%) • Literature cited • Barbour, M. T., J. Gerritsen, G. E. Griffith, R. Frydenborg, E. McCarron, J. S. White, & M. L. Bastian. 1996. A framework for biological criteria for Florida streams using benthic macroinvertebrates. J. N. Am. Benthol. Soc. 15:179-184. • Diamond, J. M., M. T. Barbour, & J. B. Stribling. 1996. Characterizing and comparing bioassessment methods and their results: a perspective. J. N. Am. Benthol. Soc. 15(4):713-727. • ITFM. 1995. The strategy for improving water-quality monitoring in the United States. Final report of the Intergovernmental Task Force on Monitoring Water Quality (ITFM). Office of Water Dara Coordination, U.S. Geological Survey, Reston, VA. OFR 95-742. • Stribling, J. B., S. R. Moulton II, & G. T. Lester. 2003. Determining the quality of taxonomic data. J. N. Am. Benthol. Soc. 22(4):621-631. Within-sampler variability (precision), Sampler B, 300-organism subsamples (n=5 sample pairs) Coefficient of variability (CV%) Target Measurement Quality Objective (MQO) = PSE ≥90% Target MQO = To be determined * Members of the NWQMC-Methods Board