Download
1 / 6
60 likes | 161 Vues
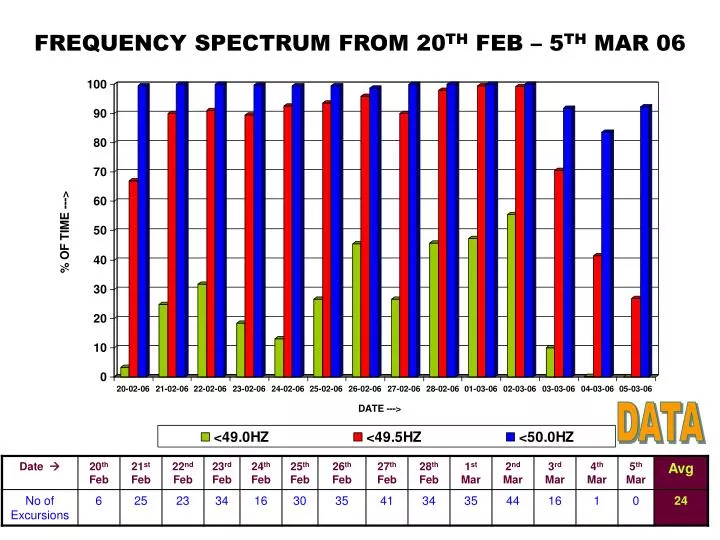
FREQUENCY SPECTRUM FROM 20 TH FEB – 5 TH MAR 06. DATA. CAPACITY BROUGHT ON BARS IN FEB 06. * December 2005 cost. STATEMENT OF OVER DRAWAL MESSAGES ISSUED TO CONSTITUENTS. DRAWAL( AVG ) PATTERN OF DIFFERENT STATES (20 TH – 26 TH FEB 06). Net Avg O/D during the day.

E N D
CAPACITY BROUGHT ON BARS IN FEB 06 * December 2005 cost
DRAWAL(AVG) PATTERN OF DIFFERENT STATES(20TH – 26TH FEB 06) Net Avg O/D during the day Net Avg O/D during the day (freq < 50.0Hz) Net Avg O/D during the day (freq < 49.0Hz) Net Avg O/D during the day (freq is 49.0 - 49.5Hz) Details
PROPOSED ACTION PLAN • Action for load control to be initiated at 49.2 Hz • Advance planning for Peak Summer by States & Generators • Effect of Frequency correction during frequency less than 49.5 Hz. for operational control • Measures to harness all possible generation during high demand period • Modification in slope of UI curve