Download
1 / 13
130 likes | 310 Vues
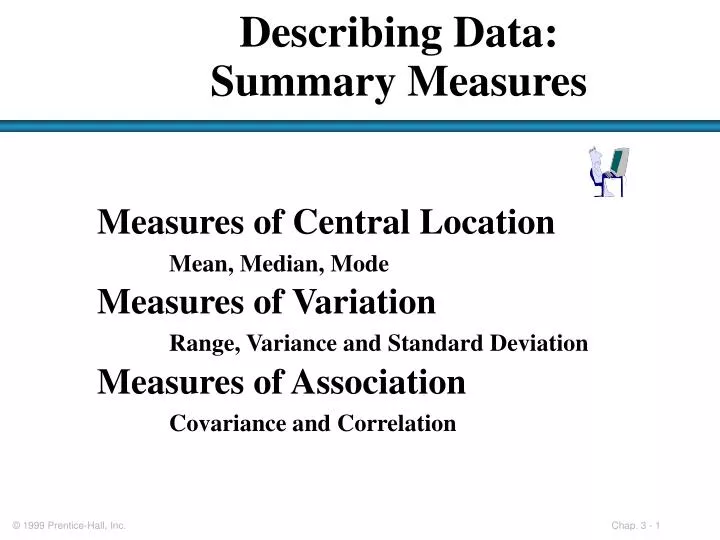
Describing Data: Summary Measures. Measures of Central Location Mean, Median, Mode Measures of Variation Range, Variance and Standard Deviation Measures of Association Covariance and Correlation. Mean. It is the Arithmetic Average of data values:

E N D
Describing Data: Summary Measures Measures of Central Location Mean, Median, Mode Measures of Variation Range, Variance and Standard Deviation Measures of Association Covariance and Correlation
Mean • It is the Arithmetic Average of data values: • The Most Common Measure of Central Tendency • Affected by Extreme Values (Outliers) + + · · · + x x x n = x å x = i 2 n i = Sample Mean i 1 n n 0 1 2 3 4 5 6 7 8 9 10 0 1 2 3 4 5 6 7 8 9 10 12 14 Mean = 5 Mean = 6
Median • Important Measure of Central Tendency • In an ordered array, the median is the • “middle” number. • If n is odd, the median is the middle number. • If n is even, the median is the average of the 2 • middle numbers. • Not Affected by Extreme Values 0 1 2 3 4 5 6 7 8 9 10 0 1 2 3 4 5 6 7 8 9 10 12 14 Median = 5 Median = 5
Mode • A Measure of Central Tendency • Value that Occurs Most Often • Not Affected by Extreme Values • There May Not be a Mode • There May be Several Modes • Used for Either Numerical or Categorical Data 0 1 2 3 4 5 6 0 1 2 3 4 5 6 7 8 9 10 11 12 13 14 No Mode Mode = 9
Measures Of Variability Variation Variance Standard Deviation Coefficient of Variation Range Population Variance Population Standard Deviation Sample Variance Sample Standard Deviation
The Range • Measure of Variation • Difference Between Largest & Smallest • Observations: • Range = • Ignores How Data Are Distributed: - x x La rgest Smallest Range = 12 - 7 = 5 Range = 12 - 7 = 5 7 8 9 10 11 12 7 8 9 10 11 12
Variance • Important Measure of Variation • Shows Variation About the Mean: • For the Population: • For the Sample: ) 2 - m å (X 2 s = i N ( ) 2 - å X X 2 = i s - n 1 For the Population: use N in the denominator. For the Sample : use n - 1 in the denominator.
Standard Deviation • Most Important Measure of Variation • Shows Variation About the Mean: • For the Population: • For the Sample: ( ) 2 - m å X s = i N ( ) 2 - å X X = i s - n 1 For the Population: use N in the denominator. For the Sample : use n - 1 in the denominator.
Sample Standard Deviation ( ) 2 For the Sample : use n - 1 in the denominator. - å X X s = i - n 1 Data:10 12 14 15 17 18 18 24 n = 8 Mean =16 s = Sample Standard Deviation= 4.2426
Comparing Standard Deviations Data A Mean = 15.5 s = 3.338 11 12 13 14 15 16 17 18 19 20 21 Data B Mean = 15.5 s = .9258 11 12 13 14 15 16 17 18 19 20 21 Data C Mean = 15.5 s = 4.57 11 12 13 14 15 16 17 18 19 20 21
Coefficient of Variation • Measure of Relative Variation • Always a % • Shows Variation Relative to Mean • Used to Compare 2 or More Groups • Formula ( for Sample):
Comparing Coefficient of Variation • Stock A: Average Price last year = $50 • Standard Deviation = $5 • Stock B: Average Price last year = $100 • Standard Deviation = $5 Coefficient of Variation: Stock A: CV = 10% Stock B: CV = 5%
Shape • Describes How Data Are Distributed • Measures of Shape: • Symmetric or skewed Right-Skewed Left-Skewed Symmetric Mean Median Mode Mean = Median = Mode Mode Median Mean