Download
1 / 11
350 likes | 811 Vues
Linear Regression. We use actual values for “ x ”… so no hat here. We are predicting the y -values, thus the “hat” over the “ y ”. slope. AP Statistics – Chapter 8. y-intercept. Residuals ( difference between observed value and predicted value).

E N D
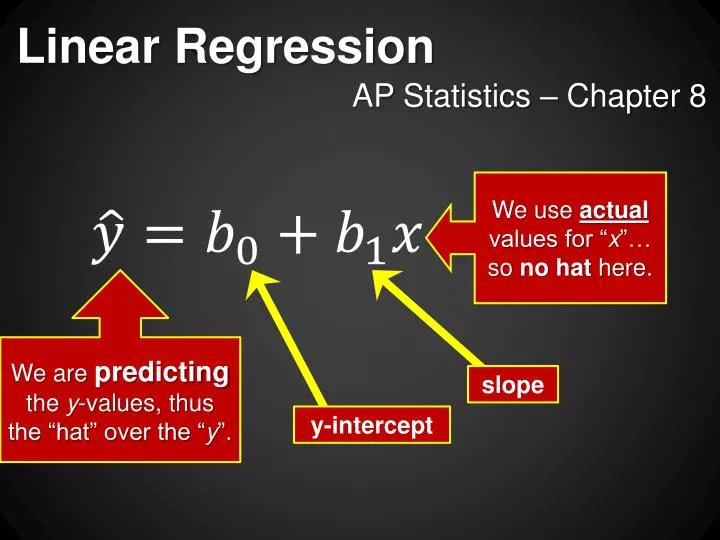
Linear Regression We use actualvalues for “x”… so no hat here. We are predicting the y-values, thus the “hat” over the “y”. slope AP Statistics – Chapter 8 y-intercept
Residuals (differencebetween observedvalue and predictedvalue) Believe it or not, our “best fit line” will actually MISS most of the points. • Residual: • Observed y – Predicted y
Every point has a residual... and if we plot them all, we have a residual plot. We do NOT want a pattern in the residual plot! This residual plot has no distinct pattern… so it looks like a linear model is appropriate.
Is a linear model appropriate? A residual plot that has no distinct pattern is an indication that a linear model might be appropriate. Not linear Linear
Least Squares Regression Line is the line (model) which minimizesthe sum of the squared residuals.
Facts about LSRL • sum of all residuals is zero(some are positive, some negative) • sum of all squared residuals is the lowest possible value (but not 0).(since we square them, they are all positive) • goes through the point [shut down the laptops, but don’t put them back yet…]
Outliers, leverage, and influence • If a point’s x-value is far from the mean of the x-values, it is said to have high leverage.(it has the potential to change the regression line significantly) • A point is considered influentialif omitting it gives a very different model.
Outlier or Influential point? (or neither?) influential point
Outlier or Influential point? (or neither?) Although this point has high leverage, deleting it would NOT change the slope drastically. neither