Download
1 / 15
170 likes | 415 Vues
Note-taking in Aviation Meteorology. Note taking is Individual. Note taking is a skill There are note taking strategies However, you must make those strategies your own. Benefits of Good Note-Taking Strategies. Good Notes: organize material for studying.

E N D
Note taking is Individual • Note taking is a skill • There are note taking strategies • However, you must make those strategies your own
Benefits of Good Note-Taking Strategies • Good Notes: • organize material for studying. • provide an opportunity for using learning strategies. • are a place to record important information. • help maintain concentration.
There are Three Stages to Note-taking • Pre • During • Post
Pre-note-taking Strategies • Be prepared intellectually • Preview the TEXT • Look at the Syllabus to know what is coming • Ask fellow classmates about the material that is coming. • Have all materials • Date and title paper
Note-taking skills during the lecture • Write clearly on one side of the paper • Listen closely for main ideas • Paraphrase -- do not copy instructor's words verbatim except when definitions or formulas are given • Take notes in semi-outline style • Use the margin as an index to your notes • Leave generous space between main ideas and sub-topics
More “During” Strategies • Write examples that the instructor gives • Watch for cues that important information is being given • Write down connections between points • Note questions, confusions, and things to look up • Number points if the number of points are being made. • Use graphics
Post Note-taking Strategies • Immediately after, look over notes to fill in missing information, expand abbreviations, etc. • Within 24 hours read through your notes, fill in gaps, and review • Index your notes • Write comments, elaborations, questions, etc. in the index • Create Big Idea Summary
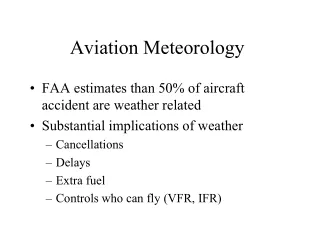
Example – Chapter 1 • Chapter 1 – The Atmosphere • Section A: Atmospheric Composition • Atmosphere – an envelope of gases surrounding the planet • Water vapor – water vapor is a variable gas; the percentage of water vapor in the atmosphere can vary greatly, depending on the location and source of the air • Particulates or aerosols – liquid or solid particles that are small enough to remain suspended in the air
Example – Chapter 1 • Section B: Atmospheric Properties • Temperature – defined in a number of ways; can be defined as a measure of the direction heat will flow; or as simply a measure of hotness or coldness; a measure of the motion of the molecules; the average of the kinetic energy of the many molecules that make up a substance; the greater the average kinetic energy, the greater the temperature • Kinetic energy – energy that exists by virtue of motion; a molecule possesses kinetic energy proportional to the square of its speed of movement • Absolute zero – a temperature of absolute zero is the point where all molecular motion ceases; 0 degrees Kelvin • Kelvin scale – the corresponding temperature scale is known as the absolute or Kelvin scale; the melting point of ice is 273 degrees Kelvin (0 degrees Celsius); the boiling point of water is 373 degrees Kelvin (100 degrees Celsius) • Density – density of a gas is the mass of the molecules in a given volume; if the total mass of molecules in that volume decrease, the density decreases; if the mass remains the same but the volume increases, the density also decreases; the units of density are expressed in terms of mass per unit volume; Figure 1-3
Example – Chapter 1 • Pressure – pressure is the force exerted by the moving molecules of the gas on a given area (square inch or square foot); pressure at a point acts equally in all directions; a typical value of atmospheric pressure at sea level is 14.7 pounds per square inch (1013.25 millibars, 29.92 inches of mercury) • The Gas Law – a unique characteristic of gases is that they obey a physical principle known as the gas law, which can be written as: • P / DT = R • P = pressure • D = density • T = absolute temperature • R = constant number which is known from experiment and theory; • R = universal gas constant = 8.3145 J/mol K • The equation states that the ratio of pressure to the product of density and temperature is always the same; if the pressure changes, then either the density or the temperature or both must also change in order for the ratio to remain constant; Figure 1-4; reduce pressure by cooling, reducing mass or increasing volume; the gas law makes the measurement of the gaseous state of the atmosphere much simpler; if we know any two of the three variables that describe the gas, we can always calculate the third; in practice, we usually measure pressure and temperature and deduce the density from the gas law
Example – Chapter 1 • Section C: Atmospheric Structure • Dimensions • we are concerned with the size of the atmosphere and its phenomena; How big? How high? How far? These are common questions asked in regard to atmospheric description; in order to keep distances and altitudes in a meaningful context, it is helpful to have some measuring sticks for reference; some of the most useful are the dimensions of the earth; Figure 1-5; distance from pole to equator = 5,397 nm; 3,438 nm radius; 21,625 nm circumference; Appendix A and units and conversions commonly used in aviation meteorology in the US; page 1-7 • Atmospheric Layers • Temperature Layers • Troposphere – in the lowest layer of the atmosphere, the average temperature decreases with altitude; the great majority of the clouds and weather occurs in the troposphere; trope = turn or change; there are often strong vertical air motions; the stability of the stratosphere and instability of the troposphere are related directly to the variation of temperature with altitude in those layers
Example – Chapter 1 • Tropopause – the top of the troposphere is about 36,000 feet above mean sea level (MSL), in middle latitudes; this upper boundary (a level, not a layer) is known as the tropopause; the temperature often reaches a minimum value at this altitude; the tropopause is a important atmospheric feature for pilots because of its connection to a variety of weather phenomena such as jet streams, clear air turbulence and thunderstorms; the altitude of the tropopause varies with latitude and season; the tropopause is lower near the poles and in winter; it is higher near the equator and in summer • Stratosphere – as we move upward from the tropopause to the stratosphere temperature tends to change slowly at first and then increase with altitude; air in the stratosphere is confined to move more or less horizontally in strata or layers; the stability of the stratosphere and instability of the troposphere are related directly to the variation of temperature with altitude in those layers • Stratopause – at the top of the stratosphere is the stratopause; it occurs at an altitude of about 160,000 feet MSL; the temperature reaches a maximum value at this height • Mesosphere – immediately above the stratopause is the mesosphere, a layer where the temperature again decreases with height; the mesosphere extends to a height of slightly more than 280,000 feet MSL, where the mesopause and the coldest temperatures in the diagram are located; Figure 1-8 • Mesopause – located at slightly more than 280,000 feet MSL, where the mesopause and the coldest temperatures are located • Thermosphere - the highest layer in the model atmosphere; temperatures generally increase with altitude in this layer; the number of air molecules is so small at these very high levels that an average kinetic energy of the air molecules does not have much meaning; objects in space at such heights have temperatures that are more closely related to radiation gain on the sun-facing side of the object and radiation loss on the opposite side
Example – Chapter 1 • Other Layers • Ozone layer – sometimes called the ozonosphere; is found in the lower stratosphere; it is characterized by a relatively high concentration of O3 with maximum concentrations near 80,000 feet MSL; the temperature maximum near the stratopause is due to the absorption of solar radiation by the ozone; Figure 1-8 • Ozone hole – region of the ozone layer with lower-than-normal O3 concentration; especially noticeable over the South Pole in spring months (September to December); the ozone hole is created when pollutants, in particular man-made chlorofluorocarbons (CFCs), reach stratospheric levels; solar radiation at those altitudes is intense enough to break the CFCs down so that the chlorine is free to destroy ozone molecules • Ionosphere – a deep layer of charged particles (ions and free electrons) that extends from the lower mesosphere upward through the thermosphere; Figure 1-8; the production of charged particles occurs at those altitudes because incoming solar radiation has sufficient energy to strip electrons from atoms and molecules; AM radio waves are reflected and/or absorbed by different sub layers of the ionosphere; radio communications may be greatly influenced by variations in the lower part of the ionosphere at sunrise and sunset and during periods of greater solar activity
Example – Chapter 1 • Other Layers - Continued • ***In the lower troposphere, pressure decreases about 1 inch of mercury (about 34 mb) for each thousand feet of altitude gain • Standard Atmosphere • the standard atmosphere, also called the international standard atmosphere (ISA), is an idealized atmosphere with specific vertical distributions of pressure, temperature, and density prescribed by international agreement; the standard atmosphere is used for several aerospace applications, such as determining altitude from pressure altimeters; the ISA for the lower stratosphere and troposphere is shown graphically in Figure 1-10 where the majority of aircraft operations take place • ***In the ISA troposphere, the temperature decreases 2 degrees Celsius for each 1,000-foot increase in altitude