Download
1 / 45
460 likes | 536 Vues
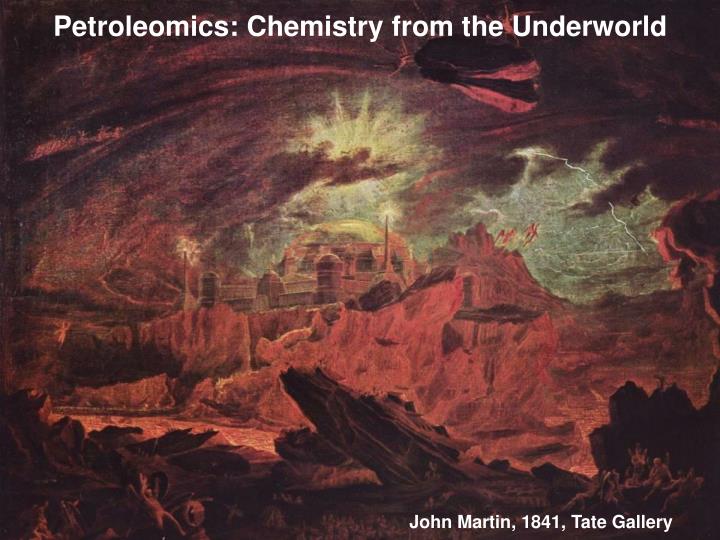
Petroleomics: Chemistry from the Underworld. John Martin, 1841, Tate Gallery. How accurate do you have to measure the mass?. C c H h N n S s O o Mass Space. (1 mDa Bins). 10. 8. 6. 4. 2. 0. 521.0. 521.1. 521.2. 521.3. 521.4. 521.5. Mass. C c H h N n S s O o Mass Space.

E N D
Petroleomics: Chemistry from the Underworld John Martin, 1841, Tate Gallery
How accurate do you have to measure the mass? CcHhNnSsOo Mass Space (1 mDa Bins) 10 8 6 4 2 0 521.0 521.1 521.2 521.3 521.4 521.5 Mass
CcHhNnSsOo Mass Space (1 mDa Bins) 10 8 6 4 2 0 521.10 521.105 521.110 521.115 521.120 Mass
CcHhNnSsOo Mass Space (0.5 mDa Bins) 7 6 5 4 3 2 1 0 521.100 521.105 521.110 521.115 521.120 Mass
~1 possibility per bin! CcHhNnSsOo Mass Space 4 (0.1 mDa Bins) 3 2 1 0 521.110 521.112 521.114 521.116 521.118 521.120 Mass
100 (-) APPI FT-ICR MS S. American Crude Oil 90 80 12,449 Assigned Masses 70 60 Relative Abundance 50 ± 100 ppb 40 30 20 10 -2 -1 0 1 2 Mass Error (ppm)
m2 m2-m1 N 459.3695 13CC31H46N2 13CC17H37 N C13H27 459.3501 C32H45NO O N High-Boiling Polar Molecules Not Resolvable by Chromatography m2-m1 Doublet 459.3899 C23H47 C30H53NS S N SH4/C33.4 mDa 135,000 C20H41 459.3865 C33H49N N C2H3/13CN17.0 mDa 27,000 O/CH436.4 mDa 13,000 H12/C 93.9 mDa 5,000 Kuangnan Qian ExxonMobil Research & Engineering C16H33 459.2960 C31H41NS S N
Resolution Requirements for Petroleum 1.1 mDa, SH313C1 vs. C4 1,800K 2.3 mDa, S2H713C1 vs. C7 3.4 mDa, C3 vs. SH4 4.5 mDa, 13C1 vs. CH 1,400K Mass Resolution 900K @ 1000 m/z 1,000K 600K 200K 200 400 600 800 1000 1200 1400 1600 1800 2000 m/z
C / H12 93.9 mDa 8.9 mDa 13C2 / C2H2 N13C / C2H3 17.1 mDa O / CH4 36.4 mDa C3 / SH4 3.4 mDa N / 13CH 8.2 mDa POLAR SPECIATION European Crude Oil 700.40 700.45 700.50 700.55 700.60 700.65 700.70 All compositional information obtained from 0.7% of a single drop of crude oil 300 400 500 600 700 800 900 1,000 m/z
0 1 2 3 4 5 6 Time (ms) 400 600 800 1000 m/z European Crude Oil Positive-Ion APPI FT-ICR MS 9.4T NON-POLAR SPECIATION 21,499 peaks > 6σ 55 peaks per nominal mass m/∆m50% = 600,000 at 600 m/z
644.50 644.51 644.52 644.53 644.54 644.55 C45H72S1 Ion Molecular Formula 50 mDa Zoom Inset C43H70S113C2 C46H6613C2 C48H68 C47H66N1 C46H65N113C1 C42H77S2 Zoom mass inset at a single Nominal Mass 644.30 644.35 644.40 644.45 644.50 644.55 644.60 644.65 m/z
ATCC# 53968 Zoom Mass Inset for both 12C and 13C Media 12C 852 853 854 855 m/z 44 Da Mass Shift---Note also 13C Isotopic Pattern Reversal 893 894 895 m/z
Compositional Analysis of Crude Oil by FT-ICR Mass Spectrometry m/Δm50% m/z 704.53510 ~ 500,000 100 - 400 ppb * [C50H72S1 + H]+ 400 500 600 700 800 m/z 1. Heteroatom Composition (Class) S1 Class 2. Type (Aromaticity or DBE DBE N H DBE = C – + + 1 2 2 McLafferty & Turecek Int. Mass Spectra, 1993 3. Carbon Number (Alkylation) Carbon Number Relative Abundance (% total)
Daily World Oil Imports by Country World Oil production is 85 million barrels per day The US consumes 20.8 million barrels per day The US consumes 43% of all the gasoline produced world wide The US accounts for 4.6% of the World’s population China and India represent 37% of the World’s population OPEC produces 42% of the world’s oil EIA
OPEC Members EIA
Shift in World Oil Production Heavy Crudes Light Crudes
Positive-Ion APPI FT-ICR MS at 9.4 Tesla Light Crude ~15,000 peaks Heavy Crude ~30,000 peaks 1200 400 600 800 1000 m/z
Petroleum Resource Pyramid Higher Quality Light Medium Heavy Increased Resource Volume USGS, McCabe 1998
Conventional and Unconventional Crude Oil Raw Oil Sands Light Crude Heavy Crude Bitumen www.syncrude.ca www.ifp.com
Currently SynCrude DilBit and SynBit
Emulsion Interfacial Material: Collection and Characterization
Water continuous Oil continuous X. Yang and J. Czarnecki, unpublished results
Oil #4 Oil #5 Oil #7 O2 20 10 0 Interfacial Material #5 Interfacial Material #7 Interfacial Material #4 Double Bond Equivalents Chemical “Targets” 20 10 0 10 10 30 50 30 50 10 30 50 Carbon Number
Relative Abundance (% total) S1 Class Image 30 S 20 DBE 10 S S 0 80 50 60 30 40 70 S Carbon Number S S S S S S DBE 19 DBE 15 19 DBE DBE 14 15 DBE 14 DBE DBE 12 12 DBE 9 DBE DBE 9 6 DBE DBE 6 3 DBE DBE 3
324.076 324.239 324.403 [C23H33N + H]+ Unprocessed Diesel Fuel [C17H36OS13C + Na]+ [C22H29NO + H]+ [C21H25NS + H]+ [C23H17NO + H]+ Processed Diesel Fuel m/z
The Asphaltene Problem Asphaltene deposition in a subsea system would devastate the operation
Deep Sea Production Facilities Oliver Mullins Schlumberger
= Nondistillable = Distillable Typical Deposition Problem FT-ICR MS Compositional Data Clearly defines the Aromaticity Differences Between Distillable and Nondistillable Fractions 40 S1 S2 30 DBE 20 10 0 20 40 60 80 20 40 60 80 Carbon Number
400 600 800 1000 1200 1400 m/z 1226 1230 1234 1238 1230.0634 1- Deposit Sample Conoco Phillips Tom Baugh Submitted 10/04 C80 H142 O8 m/Dm = 200,000 2- 3-
Crude Oil # 2 (-) Ion ESI MS 200 400 600 800 1000 1200 1400 1600 1800 2000 1230 Crude Oil # 2 Preconcentration 615 1184 200 400 600 800 1000 1200 1400 1600 1800 2000 m/z
Corrosion: Detailed Characterization of Naphthenic acids by FT-ICR MS
African Crude Negative ESI FT-ICR MS Broadband Mass Spectrum Acidic Class Image 14 12 10 DBE 8 6 4 2 0 70 80 40 50 20 30 60 Carbon Number Relative Abundance (% total) 400 600 800 1,000 1,200 1,400 m/z
Athabasca Bitumen HVGO Distillation Series Positive Ion APPI LTQ-MS IBP-343 °C 343-375 °C 375-400 °C 400-425 °C 425-450 °C 450-475 °C 475-500 °C 500-525 °C 200 300 400 500 600 700 800 m/z
20 20 20 20 20 20 20 20 16 16 16 16 16 16 16 16 12 12 12 12 12 12 12 12 8 8 8 8 8 8 8 8 4 4 4 4 4 4 4 4 0 0 0 0 0 0 0 0 20 20 20 20 20 20 20 20 30 30 30 30 30 30 30 30 40 40 40 40 40 40 40 40 50 50 50 50 50 50 50 50 60 60 60 60 60 60 60 60 Athabasca Bitumen HVGO Distillation Series Positive Ion APPI FT-ICR MS S1 Class IBP-343°C 343-375°C 375-400°C 400-425°C DBE 425-450°C 450-475°C 475-500°C 500+°C Carbon Number
Relative Abundance (% total) Slope of polymerization subunit addition in Ox classes is constant Bio-Polyol (Corn) O3 O4 O2 30 20 DBE 10 0 10 20 30 40 10 20 30 40 10 20 30 40 Carbon Number