Download
1 / 25
250 likes | 433 Vues
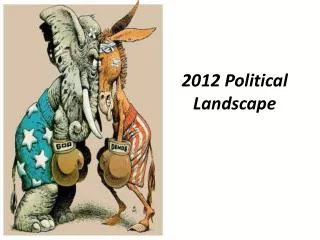
Margaret C. Kenski, Ph.D Arizona Opinion Kate Kenski, Ph.D University of Arizona. The After Election Political Landscape. Overview. Introduction: The 49% nation The 2012 election: What happened The 2012 election: Why did it happen The 2012 election: What does it mean for the future.

E N D
Margaret C. Kenski, Ph.D Arizona Opinion Kate Kenski, Ph.D University of Arizona The After Election Political Landscape
Overview • Introduction: The 49% nation • The 2012 election: What happened • The 2012 election: Why did it happen • The 2012 election: What does it mean for the future
The 49% Nation • In 2000, the nation was divided. • In 2012, the national divisions continue. • The voting public is increasingly disenchanted with both parties. • The divisions are political and cultural.
Values Gap • 10% values gap in 1987 between major party identifiers has increased to 18% in 2012 2012 • 48% approve of gay marriage • 53% agree that abortion should be legal • 46% agree that immigrants threaten American values • 40% Independents, 31% Democrats, 27% Republicans
Divisions within Parties • Republicans • RINOs versus Tea Party • Democrats • Blue Dog Democrats who are fiscally conservative versus Progressives who support big government
Historical StandardsObama Shouldn’t Have Won • 52% say things are off on the wrong track • 55% say economic conditions are poor, staying the same, or getting worse • 76% say the condition of the nation’s economy is not-so-good or poor • 43,000,000 Americans are on food stamps • 7.9% are unemployed • Avg household income has declined $4,000 since 2009 • 35% decline in the value of the avg middle class family’s assets
The 2012: What Happened • Electoral College 2012: 332 Obama 206 Romney 2008: 365 Obama 173 McCain • House 2012: 195 Democrats 234 Republicans 6 Undecided 2010: 193 Democrats 242 Republicans 0 Other • Senate 2012: 53 Democrats 45 Republicans 2 Independents 2010: 51 Democrats 47 Republicans 2 Independents • Turnout (% of those eligible to vote who actually voted) 2012: 57.5% 2008: 62.3% 2004: 60.4% 2000: 54.2%
Issues • Economy • Jobs • Immigration • GOP War on Women
Campaign Factors • Obama defined Romney • Obama had a better ground game • Romney missed opportunities • Hurricane Sandy
Future Political Landscape • Ultimately, voters opted for security over economic freedom and less regulation. • 56% of voters in OH and MI approved of the auto bailout. • Tax increase measures that affect large number of voters are opposed by the majority.
Future Political Landscape • Neither candidates nor voters endorse serious solutions • Only taxing those making over $250K enjoyed a majority of support. • That would raise $80 billion with a $1.4 trillion deficit. • National debt likely to rise to $20 trillion by 2016.
Future Political Landscape • Demographics have changed less than pundits proclaim. • Turnout raises the impact of some groups more than others. • Low Evangelical turnout in 2008 • Low White turnout in 2012 • Gender gap probably less when other factors like income and marital status are considered
Future Political Landscape • Young voters have somewhat different social values than their parents • Campaigns will continue to be negative because it works • Gridlock in Congress will lead to more government by regulations than by legislation
Future Political Landscape • Trust in government is likely to remain low 76% trusted federal government to do the right thing in 1964 8% trust the government today • Social media will continue to increase in importance as campaign media