Download
1 / 9
90 likes | 302 Vues
Bell Work. You are the head supervisor at the Shoe Department in Cleveland, Ohio. As tax season has arrived, you are trying to examine the commission amount for each salesman for this month to file your taxes accurately. Here is what we know…

E N D
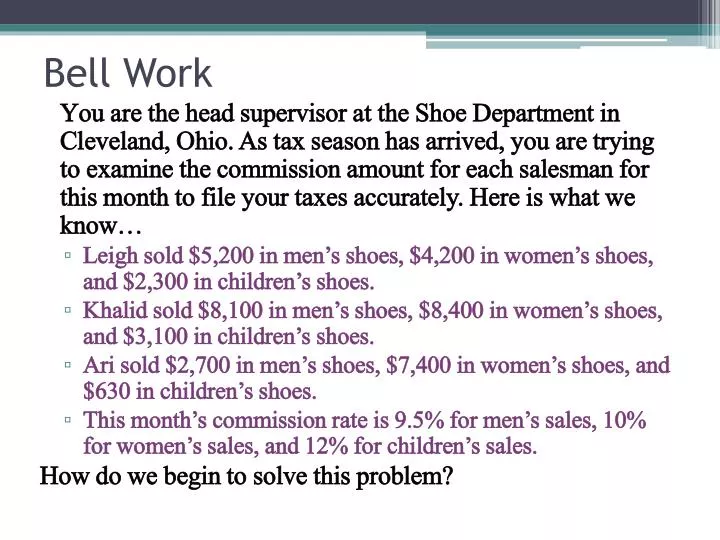
Bell Work You are the head supervisor at the Shoe Department in Cleveland, Ohio. As tax season has arrived, you are trying to examine the commission amount for each salesman for this month to file your taxes accurately. Here is what we know… • Leigh sold $5,200 in men’s shoes, $4,200 in women’s shoes, and $2,300 in children’s shoes. • Khalid sold $8,100 in men’s shoes, $8,400 in women’s shoes, and $3,100 in children’s shoes. • Ari sold $2,700 in men’s shoes, $7,400 in women’s shoes, and $630 in children’s shoes. • This month’s commission rate is 9.5% for men’s sales, 10% for women’s sales, and 12% for children’s sales. How do we begin to solve this problem?
Step Two: Create Matrices Dimensions?
Step Three: Multiply Matrices Step Four: Analyze Results • What does each number represent in our matrix product? • Who earned the most in commissions? How do you know? • Who earned the least?
Let’s Try Another Problem! Students collected recyclables for fund-raising over a 3-week period. Use what you know about matrix operations to find the total amount of money collected for each type of item. Here’s what we know about the quantity of each item recycled… • On week 1, students collected 29 pounds of glass. On week 2, students collected 25 pounds of glass. On week 3, students collected 16 pounds of glass. • On week 1, students collected 8 pounds of cans. On week 2, students collected 11 pounds of cans. On week 3, students collected 6 pounds of cans. • On week 1, students collected 163 pounds of newspapers. On week 2, students collected 127 pounds of newspapers. On week 3, students collected 206 pounds of newspapers. • On week 1, students collected 53 pounds of office paper. On week 2, students collected 107 pounds of office paper. On week 3, students collected 84 pounds of office paper.
Here’s what we know about the earnings… • During the first week, students earned $0.02 per pound for glass, $0.70 per pound for cans, $0.02 per pound for newspaper, and $1.06 per pound for office paper. • During the second week, students earned $0.02 per pound for glass, $0.55 per pound for cans, $0.01 per pound for newspaper, and $1.00 per pound for office paper. • During the third week, students earned $0.01 per pound for glass, $0.42 per pound for cans, $0.02 per pound for newspaper, and $1.03 per pound for office paper.
Step Three: Multiply Matrices Step Four: Analyze Results • Homework! • Which values matter in this matrix product? • How come the other values don’t matter? • How much did we earn from glass? Cans? Newspapers? Office Paper? • How much did the students earn total?