Download
1 / 41
440 likes | 584 Vues
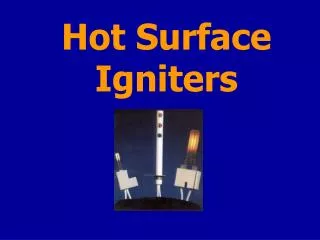
Hot Surface Ignition. SCHUYLER NICHOLS. Special Topics (Fire Dynamics) Dr. Peter Disimile Spring 2013. Basic Things to Know.

E N D
Hot Surface Ignition SCHUYLER NICHOLS Special Topics (Fire Dynamics) Dr. Peter Disimile Spring 2013
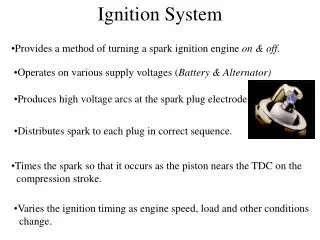
Basic Things to Know Hot Surface Ignition - The ignition of a material as the result of heat liberation due to an exothermic oxidation reaction from a hot surface, while an external ignition source such as a spark or flame is completely absent. Auto-ignition Temperature (AIT) – The minimum temperature required to initiate or cause self-sustained combustion (exothermic reaction) independent of an external ignition source. Minimum Ignition Temperature (MIT) – The minimum temperature required to initiate or cause self-sustained combustion resulting solely from a hot surface.
Controlled Sources of Hot Surface Ignition Glow Plug on a Gas Furnace Diesel Engine Glow Plug Gas Stove Glow Plug
Non-Controlled Sources of Hot Surface Ignition Fluid Hot brakes + leaking brake fluid = New Car Payment Dust Hot Conveyer Belt Bearing + Sugar Dust = No Sweets for you. Imperial Sugar Factory, 2008 Port Wentworth, Georgia Space Heater + Natural Gas Leak = Homeless Gas
Main Obstacles • Despite being a well know problem, Hot surface ignition has received • little fundamental research to help understand the ignition mechanism. • Most materials (fluids, powders, etc.) have only received superficial • treatment in literature. • Example:American Petroleum Institute recommends a general rule of • thumb that a hot surface ignition in open air should not be • assumed unless the surface temperature is about 200°C • greater than the accepted auto-ignition temperature. • Hot Surface Ignition is probabilistic in nature and cannot be defined by a single ignition temperature. In other words, ignition temperature is defined by several factors: • 1.) Surface Properties • * material • * geometry • * size • * roughness • 2.) Enviornmental Factors • * air temperature • * airflow • * humidity • 3.) Physical Properties • * chemical composition • * flash point • * volatility • 4.) Other Possible Factors • * exposure time • * etc.
Determining Auto-Ignition Temperature • The auto-ignition temperature of a number of materials (mostly flammable liquids) is reported in a large number of literature and have mainly been obtained using standardized tests such as ASTM E 659 for Chemical Liquids, ASTM G72 for Plastics, etc. • Example: • Apparatus used to measure auto-ignition temperature of liquid chemicals as defined by ASTM E 659 • Uniformly heated 500 ml glass flask • Flask contains air at a pre-determined temperature • Approximately 100ml of fluid is inserted into the flask • The Fuel/Air mixture is observed for 10 minutes, or until auto-ignition occurs. • Since auto-ignition is dependent on the mole fraction of a liquid, the ASTM E 659 standard calls for a series of tests in which the volume of liquid injected into the flask is varied until auto-ignition is finally observed. Auto-Ignition Video: http://www.youtube.com/watch?v=yG0rP3D_0-s
Determining Auto-Ignition Temperature continued… • Auto-Ignition Equation • The time it takes for a material to reach its auto-ignition temperature when exposed to • a heat flux is given by: • where : • Auto-Ignition temperatures vary widely in the available literature, with most stating that the given auto-ignition temperatures should only be used as estimates. • Causes of variation in auto-ignition temperatures include altitude, humidity, amount of time required for ignition, partial pressure of oxygen, etc.
Hot Surface Ignition of Selected Fluids Most problematic type of hot surface ignition within the aviation and automotive industries
Experimental Setup [6] • 48 cm x 38 cm x 4.8mm, 304 stainless steel plate, surrounded on three sides by draft shields. • Plate was covered with a 2.5 cm thick refractory insulation, with a 15.9 cm x 10.8 cm section in the center removed. • Electric heater consisted of a nichrome wire heating element which was powered by a 0-240 volts A.C. variac. • Single drops of fluid from a 2 mL pipette were dropped onto the center of the plate from a height of 25 cm. • Seven type K thermocouples were welded to the plate to characterize spatial temperature variations • * One T/C welded near the center of the plate • * Four T/C’s welded at 2.5 cm and 5.1 cm on either side in the x-direction. • * Two T/C’s welded at 2.5 cm on either side in the y-direction. • Plate temperatures at the seven locations were monitored using a data logger sampling at 4 samples/minute.
Experimental Setup [6] continued… • After each test, the plate temperature and ignition result were recorded. • The time between any two consecutive tests was at least 15 seconds. • To remove any residue from the surface, it was sanded with a 200 grit sand paper before testing each fluid. • Since ignition on a freshly sanded surface was observed to be more difficult, several pre-test ignitions were achieved before collecting the data set. • Since ignition is probabilistic near the ignition threshold, 200 ignition tests were conducted with each fluid such that logistic regression and goodness of fit statistical tests could be performed. • In total, over 2500 ignition tests were conducted.
Results [6] Due to the issue of overlap of the data from ignition and non-ignition cases, a single minimum ignition temperature from the hot surface is impossible to come by. Instead, a logistic regression curve fit of the data was used to help determine the Ignition Probability for each fluid over a range of temperatures. where and are the logistic regression coefficients and is the temperature. Example:
Comparisons Summary of Research Involving Hot Surface Ignition of Aviation and Automotive Liquids
Comparisons continued… Comparison of Ignition Temperature Ranges for Various Aviation Fluids • The temperature range associated with Colwell’s study corresponds to the 10% and 90% ignition probability temperatures. • All other temperature ranges that are given correspond to the lowest temperatures at which ignition did occur and the highest temperatures at which ignition did not occur. • Cases where only the lowest ignition temperature was reported are represented by a single data point.
Comparisons continued… Comparison of Ignition Temperature Ranges for Various Automotive Fluids
Observations • For each fluid the temperature range necessary to achieve ignition is generally consistent, although the ranges themselves are generally substantial. • The range tends to be largest for hydraulic and lubricating oils, but smaller for various fuels. • The temperature increase from the auto-ignition temperature to the minimum ignition temperature tends to be smaller for most of the oils than for the fuels. • In general, the minimum ignition temperatures do not seem to be related to the auto-ignition temperatures, therefore the general rule of thumb recommended by the American Petroleum Institute that a hot surface ignition in open air is about 200°C greater than the auto-ignition temperature is in poor agreement with the results. • Most cases, with the exception of Colwell, were mainly interested in obtaining the minimum ignition temperature, therefore not enough data sets were obtained to perform a good statistical analysis that could have helped mask the effect of large isolated variations in the data.
Conclusions • Unlike the auto-ignition temperature, the minimum ignition temperature is not a fundamental fluid property, and is strongly coupled to numerous factors (i.e. surface texture, airflow, liquid spray or stream, etc.) • Due to said coupling, the temperature required for ignition can vary widely. • Hot surface ignition data cannot easily be extrapolated to different conditions. • The general rules of thumb based on the auto ignition temperature can be very inaccurate.
Hot Surface Ignition of Selected Dusts Very problematic type of hot surface ignition within many manufacturing industries
Background • When the rate of heat release generated by the oxidation of combustible materials exceeds the rate of heat loss, the temperature rises within the system, consequently accelerating oxidation reactions, until self ignition occurs. • Industrial plants, storages, silos, hoppers, driers, mixing plants, etc, are common places that this phenomena can occur, and can often lead to impressive and hazardous physical manifestations, such as dust explosions. • Since 1999, the ATEX (Explosive Atmosphere) regulations require employers to carry out hazard identifications, risk assessments, and to take prevention measures regarding the explosion of gas, vapors, and dusts. • The European directive 1999/92/EC especially requires the following actions concerning the production or the storage of combustible dusts: • * The avoidance of the formation of explosive atmosphere • (clouds or dust layers) • * The avoidance of igniting an explosive atmosphere. • * A reduction of the damages for a potential explosion on • workers • Hot Surface Ignition of Dust Video: http://www.youtube.com/watch?v=Jg7mLSG-Yws
Background continued… • Due to a high number of industrial dust fires that occurred from the industrial revolution all the way up through the 1960’s, the MIT of dust layers for particular dusts was introduced to specify safe surface temperatures or maximum permissible surface temperatures (MPST). • The MIT at which dust ignites is typically determined by hot plate testing according to EN 50281-2-1 (European Standards), IEC 61241-2-1 (International Electrotechnical Commission), and ASTM E2021 (American Society for Testing and Materials). • Experiments to determine the MIT of dust layers can be costly and very hard to carry out when considering all the factors that the dust layers may experience in actual industry conditions. • To try and avoid the high cost and complexity of carrying out physical experiments to determine MIT, many industries have resorted to creating mathematical models to simulate self ignition. These mathematical models allow for multiple factors to be considered all at once that would be very difficult or require lengthy preparation to set up in a physical experiment. • Example: • * Dust composition • * Dust Deposition Configuration • * Surface Material • * Heating Conditions • * Airflow • * etc.
Experimental Setup [18] • Magnesium powder layers were conducted with four different particle sizes: 6, 47, 104, and 173 mm • Dust Container was a stainless steel ring, 45 mm diameter and 30 mm high, position on the center of a stainless steel plate. • Five bare thermocouples with a bead size of 0.5 mm O/D were placed throughout the dust layer. • Thermocouples were positioned at 6, 12, 18 and 24 mm in height from the hot surface for experiments estimating effective dust layer thermal conductivity, and at 3, 6, 15, and 24 mm in height for other ignition tests. • After thermocouple positioning, surface temperature of the plate was set using a ND8000 temperature controller. • Once the plate temperature was stable, the ring was gently filled with Mg powder equilibrated to ambient temperature. • Dust layer temperatures were measured and recorded by a DT9805 temperature recording device. • All tests were done in a quiescent environment with ambient temperature at 300 K. • Tests were run until either the layer temperature reached equilibrium for no less than 60 minutes, or a clear thermal runaway was observed. • Inherent uncertainty of the test apparatus was within acceptable limits given a testing resolution of 5 K in layer ignition temperature. • Fresh magnesium powders were used for each test.
Mathematical Model [18] Equation for Temperature Distribution • In the Case of the deposited on a flat plate, the dust layer is considered to have infinite thickness L. • Due to the relatively slow oxidation process leading to ignition, it is assumed that oxygen diffusion from the face exposed to the atmosphere was sufficiently fast that the reaction was not oxygen diffusion limited. • Diffusion resistance for the oxidizing agent was neglected. • A heterogeneous reaction at magnesium particle surfaces is also assumed. • A one-dimensional non-equilibrium heat conduction equation for the dust layer is written as: • (Eqn. 1) • where: k = thermal conductivity of a dust layer (W m-1 K-1) • T = temperature (K) • rb= packing density (kg m-3) • c = specific heat of the dust (J kg-1 K-1) • DHR= heat of reaction (J kg-1) • A = Arrhenius pre-exponential factor (s-1) • E = activation energy (J mol-1) • R = universal gas constant • To stay in line with the experimental ignition procedure, the powder inside the ring is equilibrated to ambient room temperature of: • T = Ta = 300K, at time t = 0. (Eqn. 2)
Mathematical Model [18] continued… Equation for Temperature Distribution • Boundary Conditions: • At the cool surface of the dust layer: • (Eqn. 3) • At the hot-plate surface: • (Eqn. 4) • where: h = hc+ hris the total heat transfer coefficient (W m-2 K-1) accounting for the convective (hc) • and radiant (hr) heat transfer coefficients. • Ts = top surface temperature (K) • Tp= hot plate temperature (K) • s= Stefan-Bolzmann constant • e = emissivity of layer surface
Mathematical Model [18] continued… Equation for Temperature Distribution • Using equations 1 – 4 are re-written in non-dimensional form: • (Eqn. 5) • (Eqn. 6) • (Eqn. 7) • (Eqn. 8)
Mathematical Model [18] continued… Solving Non-Dimensional Equations • The discretization of non-dimensional equations was carried out using the finite volume method. • The arrangement of grid point and the associated control volume is shown in the following figure: • Temperature at the bottom of the and top surfaces of dust layers is denoted by and • The total number N of grid points in the thickness dimension was set to 100 (i.e. ) for numerical simulations, which means the mesh size was about 0.3 mm in height. • Solving the non-dimensional equations 5 – 8 was done using a stepwise timing method beginning with the initial temperature distribution (Eqn. 8). • Given the grid point value of at time , the typical time step task was to find the values of at
Mathematical Model [18] continued… Solving Non-Dimensional Equations • The corresponding discretization equations of equations 5 – 8 were derived in a fully implicit scheme as: • (Eqn. 9) • (Eqn. 10) • (Eqn. 11) • (Eqn. 12)
Mathematical Model [18] continued… Solving Non-Dimensional Equations • For interior points , equation 9 was rewritten in the following form as: • (Eqn. 13) • where, • (Eqn. 14) • (Eqn. 15) • (Eqn. 16) • For the boundary point : • (Eqn. 17)
Mathematical Model [18] continued… Solving Non-Dimensional Equations • For the boundary point : • (Eqn. 18) • (Eqn.19) • (Eqn. 20) • (Eqn. 21)
Mathematical Model [18] continued… Solving Non-Dimensional Equations • Local temperatures in the discretization equations were calculated using a Tri-Diagonal Matrix Algorithm. • Computation convergence at all grid points was considered to occur at a grid in the successive iterative step when the maximum temperature difference was <0.001 • A variable time step was needed to compute the detailed temperature distribution beyond the time of thermal runaway, so the following scheme was used to automatically adjust the time step along with nodal temperature changes on the grid occurring during computations: • (Eqn. 22) • The initial time step in the computation was set to 5 sec.
Mathematical Model [18] continued… Estimation of Input Parameters • Effective thermal conductivity (k)in equation 1 would influence the temperature distribution inside the dust layer, so some testing was initially carried out to determine the parameters at a lower hot plate temperature. • The remaining input parameters were obtained from literature references.
Results [18] Temperature Change Inside Magnesium Powder Layers in Contact with the Heated Plate • The temperature of the heated plate was set at 710 K and the Magnesium particle size used was 6 mm. • The dotted curves correspond to the data simulation model, whereas the solid curves correspond to the data from the experiment. • The sharp incline at the end of each curved indicates when ignition occurs.
Results [18] continued… Temperature Change Inside Magnesium Powder Layers in Contact with the Heated Plate • The layer thickness that was used was 6 mm. • The plate temperature was initially set at 710 K, but was then increased each time a larger particle size was being used in order to achieve ignition, with 763 K being the highest plate temperature when the 173 mm particle size was being tested.
Observations • No mater the material or the experiment setup, all data tends to show the same trend in regards to the relationship between the layer thickness and the MIT, as well as the particle size and MIT. • All simulation models were dependent to some degree on data from actual experiments in order to set initial and boundary conditions. • Although the curves from simulation seemed to generally follow the same trend as the curves from the experimental data. • The MIT temperature generally seems to be considerably higher for inorganic materials such as metal dusts versus organic materials such as wood or wheat dusts.
Conclusions • No matter the material, all experimental data, as well as simulation data proves that there is a direct relation between the thickness of the dust layer and the MIT. The thicker the dust layer, the lower the MIT will be. • Much like the previous relation, the experimental and simulation data proves that there is also a direct relation between the particle size and the MIT. The larger the particle size, the higher the MIT will be. • Although the data from experiment vs. simulation follows the same general trend, the discrepancies between the two would still be large enough to cause concern if an industry was wanting to use simulation data to set their safety standards. • The resulting experiments and simulations failed to take into account the many other factors that could easily influence MIT, such as different surface textures, airflow, humidity, cracks in the layers, etc. Until all factors can be taken into account, most industries are going to be left having to enforce very large safety factors that in the long run could end up hurting productivity.
Hot Surface Ignition of Selected Gases An all around general hazard
SORRY!!!! Great opportunity for some personal research.
REFERENCES 1.) Davis, S.; Kelly, S.; Somandepalli, V., “Hot Surface Ignition of Performance Fuels” Fire Technology, ISSN 0015-2684, 04/2010, Volume 46, Issue 2, pp. 363 - 374 2.) “Ignition Risk of Hydrocarbon Liquids and Vapors by Hot Surfaces in the Open Air” API Recommended Practice 2216, Third Edition, December 2003 3.) Colwell, Jeff D., “Hot Surface Ignition” Exponent Failure Analysis Associates 4.) Bowes, P.C. and Townshend, S.E., “Ignition of Combustible Dusts on Hot Surfaces” British Journal of Applied Physics, ISSN 0508-3443, 03/1962, Volume 13, Issue 3, pp. 105 - 114 5.) Palmer, K.N. and Tonkin, P.S., “The Ignition of Dust Layers on a Hot Surface” Combustion and Flame, ISSN 0010-2180, 1957, Volume 1, Issue 1, pp. 14 – 18 6.) Colwell, Jeff D. and Reza, Ali, “Hot Surface Ignition of Automotive and Aviation Fluids” Fire Technology, ISSN 0015-2684, 04/2005, Volume 41, Issue 2, pp. 105 – 123 7.) API, “Ignition Risk of Hot Surfaces in Open Air,” API 2216, American Petroleum Institute, Washington D.C., 1991. 8.) S.M. Arndt, D.C. Stevens, and M.W. Arndt, “The Motor Vehicle in the Post-Crash Environment, An Understanding of Ignition Properties of Spilled Fuels,” SAE Paper No. 1999-01-0086, 1999. 9.) D.M. Severy, D.M. Blaisdell, and J.F. Kerkhoff, “Automotive Collision Fires,” in Proceedings of Eighteenth STAPP Car Crash Conference, Society of Automotive Engineers, Warrendale, PA, December 4–5, 1974, pp. 113–199. 10.) J.G. Foose, “F-16 Engine Nacelle Fire-Prevention Requirements Study,” General Dynamics Report No. 16PR2771, 1983 11.) A.M. Johnson, A.J. Roth, and N.A. Moussa, “Hot Surface Ignition Tests of Aircraft Fluids,” Report No. AFWAL-TR-88-2101, Wright-Patterson Air Force Base, OH, 1988. 12.) L. Parts, “Assessment of the Flammability of Aircraft Hydraulic Fluids,” Report No. AFAPLTR- 79-2055, Wright-Patterson Air Force Base, OH, 1979. 38
REFERENCES continued… 13.) D.J. Myronuk, “Dynamic, Hot Surface Ignition of Aircraft Fuels and Hydraulic Fluids,” Report No. AFAPL-TR-79-2095, Wright-Patterson Air Force Base, OH, 1980. 14.) A. Strasser, N.C. Waters, and J.M. Kuchta, “Ignition of Aircraft Fluids by Hot Surfaces Under Dynamic Conditions,” Bureau of Mines PMSRC Report No. 4162, Report No. AFAPL-TR-71- 86, Wright-Patterson Air Force Base, OH, 1971. 15.) “Correlation between self-ignition of a dust layer on a hot surface and in baskets in an oven” Journal of Hazardous Materials, ISSN 0304-3894, 11/2008, Volume 159, pp. 528 – 535 16.) Aristov, V. F; Barzykin, V. V; Krishenik, P. M; Rozenband, V. I, “Surface hot-Spot ignition of a layer of metal powder in oxygen,” Combustion, Explosion, and Shock Waves, ISSN 0010-5082, 03/1985, Volume 21, Issue 2, pp. 131 – 137 17.) Miron, Y and Lazzara, CP, “Hot-surface ignition temperature of dust layers,” Fire and Materials, ISSN 0308-0501, 1988, Volume 12, Issue 3, pp. 115 - 126 18.) Chunmiao, Yuan; Dezheng, Huang; Chang, Li; Gang, Li, “Ignition behavior of magnesium powder layers on a plate heated at constant temperature,” Journal of hazardous materials, ISSN 0304-3894, 02/2013, Volume 246-247, p. 283 19.) Quintiere, James G, “Principles of Fire Behavior,” Delmar Publishers, ISBN 9780827377325, 1998, xi, 258 20.) http://www.youtube.com/watch?v=yG0rP3D_0-s 21.) http://www.youtube.com/watch?v=Jg7mLSG-Yws 39