Download
1 / 63
760 likes | 1.12k Vues
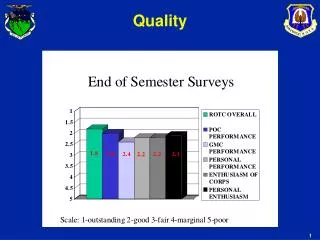
QUALITY. Learning Objectives. At the end of the training, participants are expected to: Understand the basics and importance of quality and appreciate the available standards and certifications .

E N D
Learning Objectives • At the end of the training, participants are expected to: • Understand the basics and importance of quality and appreciate the available standards and certifications. • Select, interpret and evaluate the applicability of various quality management concepts and tools to real life situations.
Module 1 quality
Section 1 Principles of quality management
Defining Quality Quality has been defined in many different ways and the following are the most widely used definitions of quality “Quality means the features of products which meet customer demands and thereby achieving customer satisfaction” “Quality means freedom from deficiencies”
Garvin’s Definition David A. Garvin – a professor of C. Roland Christensen of Business Administration at the Harvard Business School He has defined quality according to the following five co-existing definitions, which are:
Garvin’s Definition There are 8 for product and 10 for the service on his definition of quality.
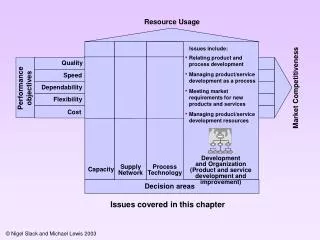
Quality Perception Quality can be perceived in many different ways by different functions in an organization as per;
Quality Control Defined • Is the traditional way that businesses have used to manage quality. • Quality control is concerned with checking and reviewing work that has been done. • Is a system of routine technical activities, to measure and control the quality of the product as it is being developed. • Quality control is designed to: • Provide routine and consistent checks to ensure data integrity, correctness and completeness • Identify and address errors and omissions
Quality Assurance Defined Is about developing an internal system which develops data over time that would signify the products produced and that any errors were detected, removed from the system. Is the systematic monitoring and evaluation of the various aspects of product, project, service or facility to maximize the probability that minimum standards of quality are being attained by the processes BS 5750 states that quality assurance is all “those planned and systematic actions necessary to provide adequate confidence that a product or service will satisfy given requirements of quality”.
Quality Management System Defined Joseph M. Juran is a management consultant who is known as an evangelist for quality and quality management Quality system is represented by Juran’s Trilogy using the following three main processes
Quality Management System Defined There are 10 subsystems within a quality system and they are:
Quality Gurus Edwards Deming Joseph M. Juran Armand V. Feigenbaum Kaoru Ishikawa Genichi Taguchi Shigeo Shingo Philip B. Crosby Writers and practitioners whose ideas come to form this body of accepted knowledge, who lead and advise a movement, become known as the ‘gurus’;
Deming William Edwards Deming • American statistician, professor, author, lecturer and consultant Deming has four principal models and methods: • The PDCA Cycle • Statistical Process Control • The 14 Principles of Management • The 7 Point Action Plan
The PDCA Cycle Implement the processes. Establish the objectives and processes necessary to deliver results in accordance with the specifications. Apply actions to the outcome for necessary improvement. This means reviewing all steps (Plan, Do, Check, Act) and modifying the process to improve it before its next implementation. Monitor and evaluate the processes and results against objectives and Specifications and report the outcome.
14 Principles of Management 9. Breakdown barriers between departments Eliminate numerical goals, posters, slogans for the workforce, asking for new levels of productivity without providing methods Eliminate work standards that prescribe numerical quotas (500 acceptable units produced per time is acceptable rather than 500 units produced per time) 12. Remove barriers that stand between the hourly worker and his right of pride of workmanship 13. Institute a vigorous program for education and training 14. Create a structure in top management that will push every day the 13 points above
The 7 Point Action Plan Management Direction 1 Management Commitment 2 Proper Communication of Information 3 Customer Focus 4 PDCA – Basis for Quality Improvement 5 Team Work 6 Organization for Quality 7
The Quality Planning Roadmap Identify the customers 1 Determine the needs of the customers 2 Translate those needs into the organizational language 3 Develop a product that can respond to those needs 4 Optimize the product features 5 Develop a process to produce the product identified 6 Optimize the process 7 Prove that the process can produce the product 8 Transfer the process to operations 9
Crosby’s 14 Points • Philip Bayard “Phil” Crosby • Initiated “Zero Defects” Make it clear that management is committed to quality Form quality improvement teams with representatives from each department Determine where current and potential quality problems lie Evaluate the cost of quality and explain its use as a management tool Raise the quality awareness and personal concern of all employees Take actions to correct problems identified through previous steps Establish a committee for the Zero defects program
Crosby’s 14 Points 8. Train supervisors to actively carry out their part of the quality improvement program 9. Hold a Zero defects day to let everyone realize that there has been a change 10. Encourage all individuals to establish improvement goals for themselves and their groups 11. Encourage employees to communicate to management the obstacles they face in attaining their improvement goals 12. Recognize and appreciate those who participate 13. Establish quality councils to communicate on a regular basis 14. Do it all over again to emphasize that the quality improvement program never ends
Section 2 QUALITY FRAMEWORKS AND STANDARDS
International Standards and Best Practices What are standards? Standards are documented agreements containing technical specifications or other precise criteria to be used consistently as rules, guidelines, or definitions of characteristics, to ensure that materials, products, processes and services are fit for their purpose.
Some Common Standards The ISO film speed code, among many other photographic equipment standards Standardization of the format of telephone and banking cards M, kg, s, A, K, mol, cd universal measurement systems Paper Sizes
ISO 9000 Family of Standards • ISO 9000:2005 – Quality Management Systems – Fundamentals and Vocabulary • ISO 9001:2008 – Quality Management Systems – Requirements • ISO 9004:2009 – Managing for the sustained success of an organization – A quality management approach • ISO 17021:2006 – Conformity Assessment – Requirements for bodies providing audit and certification of management systems • ISO 19011:2002 – Guidelines for quality and/or environmental management systems auditing
Deming’s Model: Quality Chain Reaction Improve Quality Cost decrease because less rework, fewer mistakes, delays, snags; better use of machine time and materials Stay in business Capture the market with better quality and lower prices Productivity Improves Provide jobs and more jobs “So Simple!”
Seven Deadly Diseases Lack of constancy of purpose. Emphasis on short-term profits. Evaluation by performance, merit rating, or annual review of performance Mobility of management. Running a company on visible figures alone. Excessive medical costs. Excessive costs of warranty, fueled by lawyers who work for contingency fees.
The Past and the Present The Past and the Present
Section 3 Quality management tools
Basic 7 QC Tools Check sheets Histogram Pareto Chart Flow chart Cause and Effect diagram Scatter Diagram Control Chart
A form or a tally sheet, used to physically track the frequency of one or more specific events or problems (usually one or more mark per occurrence) The check sheet is a simple document that is used for collecting data in real-time and at the location where the data is generated. Designed for the quick, easy, and efficient recording of the desired information, which can be either quantitative or qualitative Types of Check sheet: Classification, Location, Frequency, Measurement Scale, Checklist
Histogram • A bar chart showing distribution of variables • This tool helps identify the cause of problems in a process by the shape of the distribution as well as the width of distribution • It provides a graphical picture of the frequency distribution of a measured quality characteristic such as temperature, time and height • Histogram is normally used under the following situations. • To display large amounts of data values in a relatively simple chart form • To tell relative frequency of occurrence • To understand the central tendency & spread of the data • To understand overall distribution of the data
Pareto Chart Named after Vilfredo Pareto, an Italian Sociologist and Economist who invented this tool by the end of the 19th century. Also known as the principle of “Vital few versus Trivial Many”. It highlights the most important set of factors “Pareto principle” states that 80 percent of the variation of any characteristic is caused by only 20 percent of all possible variables The Pareto chart often represents the most common sources of defects, the highest occurring type of defect, or the most frequent reasons for customer complaints, etc.
Flow Charts Start Process 1 Process 2 Approved? Yes End No Allows the teams to identify the actual flow or sequence of events in a process that any product or service follows It is a schematic representation of the details of a process Starting point for analysis of the existing system/process to identify areas for improvement
Cause & Effect Diagram • The Cause and Effect diagram (aka fishbone diagram or Ishikawa diagram) is the brainchild of Kaoru Ishikawa who is also a pioneer in Quality Management • With the Ishikawa Diagram, all possible causes of a result/problem can be identified • CAUSE AND EFFECT DEFINITION • EFFECT - Effect is a result or outcome which is the problem to be resolved. What has happened is the Effect. • CAUSE - Reason or Factor contributing to the Effect. Why it has happened is the Cause.
Cause & Effect Diagram SAMPLE CAUSE & EFFECT DIAGRAM
Scatter Diagram A scatter graph or scatter diagram is a type of display that contains one or more scatter plots each of which use Cartesian coordinates to display values for two variables for a set of data. A scatterplot can suggest various kinds of correlations between variables with a certain confidence level. Correlations may be positive (rising), negative (falling), or null (uncorrelated). Scatter diagrams are classified into the following types based on the types of correlation: Strong Positive, Strong Negative, Weak Positive, Weak Negative and No Correlation.
Control Charts Control Chart is a tool used to determine whether a manufacturing or business process is in a state of statistical control or not. A control chart is a specific kind of run chart that allows significant change to be differentiated from the natural variability of the process. If the process is in control, all points will plot within the control limits. Any observations outside the limits, or systematic patterns within, suggest the introduction of a new, source of variation.
Section 4 QUALITY IN SERVICE INDUSTRIES
Customer Perceived Quality • The prefix of “customer perceived” has been added to quality purposely. It is not the quality as perceived by the organization, but the quality of product or service as perceived by the customer. • Some of the following factors play a vital role in customer perceived quality:
Introduction • Service quality is not one-dimensional. • The quality of service delivery results in customer satisfaction and their retention as it reinforces the perception that the value of the service received is greater than the price paid for it. • Customer perception, service quality and profitability are independent variables • The task is made more complicated in the case of service because of the intangible nature of service and the variation in services offered to different customers • Reasons why customer must be given quality service: • If the customers are lost, it can be extremely difficult to win back the individual. • Most customers do not complain when they experience problems, these customer opt out and take their business elsewhere
Dimensions of Service Quality Reliability – refers to the ability of the provider to perform the promised service dependably and accurately “Customers expect that providers will do what they say and they will do when they say they will do it” Tangibles – refers to the appearance of the physical facilities, equipment, personnel and communication materials “As services are intangible, the tangibles gives an impression to the customers about the quality of service they can expect from the provider” Responsiveness – refers to the willingness of the employees to help customers and provide prompt service.
Dimensions of Service Quality Assurance – this factor is linked with competence, courtesy, credibility and security Competency – required skills and knowledge to perform the service Courtesy – politeness, respect, consideration and friendliness Credibility – perceived trustworthiness, believability and honesty Security – free from danger, risk and doubt “In summary, Assurance refers to the knowledge and courtesy of employees and their ability to inspire trust and confidence”. Empathy – refers to the caring, individualized attention that the provider gives its customers. This includes access, communication and understanding Access – approachability and ease Communication – keeping customer informed using the common language Understanding – efforts made to know customer needs
Service Quality Gaps The service provider does not know what customer expects Between what the customer expects and what the management understands as the customer’s expectation from the provider With reference to the management’s understanding of the customer expectations and the service quality standards set by the management Between the quality specifications and actual service delivery Between what is communicated to customers and what is actually delivered
Strategies for Closing the Gaps Internal and external research What do customers really want from service and create value Listening to what customers and employees feel about performance Improve the technical service quality as well as functional service quality Evaluation of performance Action Monitoring Improving Motivation
Customer Retention & Relationship Marketing • It is more economical to retain a customer than to get a new one. • The challenge is make customers use more services that the provider is offering. • The quality of relationship is emerging as a measure of success. • In manufacturing, “Zero-defect” matters while in service industry, service quality matters most. It is the quality of interaction with the customers that matters most.