Download
1 / 1
10 likes | 82 Vues
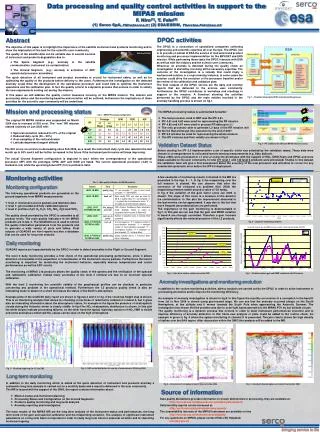
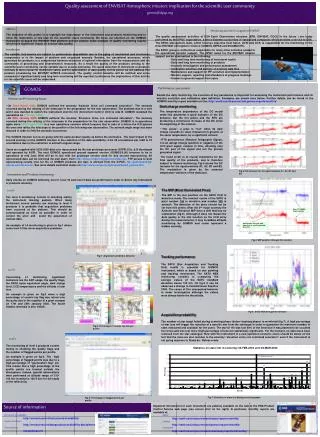
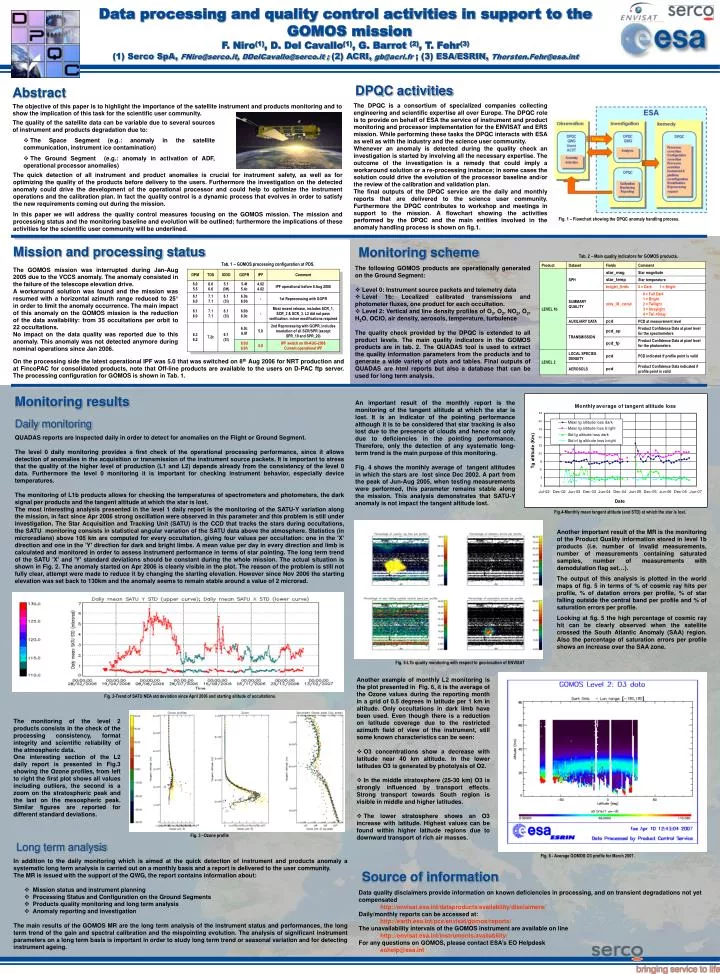
Fig. 5-L1b quality monitoring with respect to geo-location of ENVISAT. Fig. 2-Trend of SATU NEA std deviation since April 2006 and starting altitude of occultations. Fig. 3 –Ozone profile. Fig. 6 - Average GOMOS O3 profile for March 2007.

E N D
Fig. 5-L1b quality monitoring with respect to geo-location of ENVISAT Fig. 2-Trend of SATU NEA std deviation since April 2006 and starting altitude of occultations. Fig. 3 –Ozone profile Fig. 6 - Average GOMOS O3 profile for March 2007. Data processing and quality control activities in support to the GOMOS mission F. Niro(1), D. Del Cavallo(1), G. Barrot (2), T. Fehr(3) (1) Serco SpA, FNiro@serco.it, DDelCavallo@serco.it ; (2) ACRI, gb@acri.fr ; (3) ESA/ESRIN, Thorsten.Fehr@esa.int DPQC activities Abstract The DPQC is a consortium of specialized companies collecting engineering and scientific expertise all over Europe. The DPQC role is to provide on behalf of ESA the service of instrument and product monitoring and processor implementation for the ENVISAT and ERS mission. While performing these tasks the DPQC interacts with ESA as well as with the industry and the science user community. Whenever an anomaly is detected during the quality check an investigation is started by involving all the necessary expertise. The outcome of the investigation is a remedy that could imply a workaround solution or a re-processing instance; in some cases the solution could drive the evolution of the processor baseline and/or the review of the calibration and validation plan. The final outputs of the DPQC service are the daily and monthly reports that are delivered to the science user community. Furthermore the DPQC contributes to workshop and meetings in support to the mission. A flowchart showing the activities performed by the DPQC and the main entities involved in the anomaly handling process is shown on fig.1. The objective of this paper is to highlight the importance of the satellite instrument and products monitoring and to show the implication of this task for the scientific user community. • The quality of the satellite data can be variable due to several sources of instrument and products degradation due to: • The Space Segment (e.g.: anomaly in the satellite communication, instrument ice contamination) • The Ground Segment (e.g.: anomaly in activation of ADF, operational processor anomalies) The quick detection of all instrument and product anomalies is crucial for instrument safety, as well as for optimizing the quality of the products before delivery to the users. Furthermore the investigation on the detected anomaly could drive the development of the operational processor and could help to optimize the instrument operations and the calibration plan. In fact the quality control is a dynamic process that evolves in order to satisfy the new requirements coming out during the mission. In this paper we will address the quality control measures focusing on the GOMOS mission. The mission and processing status and the monitoring baseline and evolution will be outlined; furthermore the implications of these activities for the scientific user community will be underlined. Fig. 1 – Flowchart showing the DPQC anomaly handling process. Mission and processing status Monitoring scheme Tab. 2 – Main quality indicators for GOMOS products. Tab. 1 – GOMOS processing configuration at PDS. • The following GOMOS products are operationally generated on the Ground Segment: • Level 0: Instrument source packets and telemetry data • Level 1b: Localized calibrated transmissions and photometer fluxes, one product for each occultation. • Level 2: Vertical and line density profiles of O3, O2, NO2, O2, H2O, OClO, air density, aerosols, temperature, turbulence • The quality check provided by the DPQC is extended to all product levels. The main quality indicators in the GOMOS products are in tab. 2. The QUADAS tool is used to extract the quality information parameters from the products and to generate a wide variety of plots and tables. Final outputs of QUADAS are html reports but also a database that can be used for long term analysis. The GOMOS mission was interrupted during Jan-Aug 2005 due to the VCCS anomaly. The anomaly consisted in the failure of the telescope elevation drive. A workaround solution was found and the mission was resumed with a horizontal azimuth range reduced to 25° in order to limit the anomaly occurrence. The main impact of this anomaly on the GOMOS mission is the reduction of the data availability: from 35 occultations per orbit to 22 occultations. No impact on the data quality was reported due to this anomaly. This anomaly was not detected anymore during nominal operations since Jan 2006. On the processing side the latest operational IPF was 5.0 that was switched on 8th Aug 2006 for NRT production and at FincoPAC for consolidated products, note that Off-line products are available to the users on D-PAC ftp server. The processing configuration for GOMOS is shown in Tab. 1. Monitoring results An important result of the monthly report is the monitoring of the tangent altitude at which the star is lost. It is an indicator of the pointing performance although it is to be considered that star tracking is also lost due to the presence of clouds and hence not only due to deficiencies in the pointing performance. Therefore, only the detection of any systematic long-term trend is the main purpose of this monitoring. Fig. 4 shows the monthly average of tangent altitudes in which the stars are lost since Dec 2002. A part from the peak of Jun-Aug 2005, when testing measurements were performed, this parameter remains stable along the mission. This analysis demonstrates that SATU-Y anomaly is not impact the tangent altitude lost. Daily monitoring QUADAS reports are inspected daily in order to detect for anomalies on the Flight or Ground Segment. The level 0 daily monitoring provides a first check of the operational processing performance, since it allows detection of anomalies in the acquisition or transmission of the instrument source packets. It is important to stress that the quality of the higher level of production (L1 and L2) depends already from the consistency of the level 0 data. Furthermore the level 0 monitoring it is important for checking instrument behavior, especially device temperatures. The monitoring of L1b products allows for checking the temperatures of spectrometers and photometers, the dark signal per products and the tangent altitude at which the star is lost. The most interesting analysis presented in the level 1 daily report is the monitoring of the SATU-Y variation along the mission, in fact since Apr 2006 strong oscillation were observed in this parameter and this problem is still under investigation. The Star Acquisition and Tracking Unit (SATU) is the CCD that tracks the stars during occultations, the SATU monitoring consists in statistical angular variation of the SATU data above the atmosphere. Statistics (in microradians) above 105 km are computed for every occultation, giving four values per occultation: one in the 'X' direction and one in the 'Y' direction for dark and bright limbs. A mean value per day in every direction and limb is calculated and monitored in order to assess instrument performance in terms of star pointing. The long term trend of the SATU 'X' and 'Y' standard deviations should be constant during the whole mission. The actual situation is shown in Fig. 2. The anomaly started on Apr 2006 is clearly visible in the plot. The reason of the problem is still not fully clear, attempt were made to reduce it by changing the starting elevation. However since Nov 2006 the starting elevation was set back to 130km and the anomaly seems to remain stable around a value of 2 microrad. Fig.4-Monthly mean tangent altitude (and STD) at which the star is lost. Another important result of the MR is the monitoring of the Product Quality information stored in level 1b products (i.e. number of invalid measurements, number of measurements containing saturated samples, number of measurements with demodulation flag set…). The output of this analysis is plotted in the world maps of fig. 5 in terms of % of cosmic ray hits per profile, % of datation errors per profile, % of star falling outside the central band per profile and % of saturation errors per profile. Looking at fig. 5 the high percentage of cosmic ray hit can be clearly observed when the satellite crossed the South Atlantic Anomaly (SAA) region. Also the percentage of saturation errors per profile shows an increase over the SAA zone. • Another example of monthly L2 monitoring is the plot presented in Fig. 6, it is the average of the Ozone values during the reporting month in a grid of 0.5 degrees in latitude per 1 km in altitude. Only occultations in dark limb have been used. Even though there is a reduction on latitude coverage due to the restricted azimuth field of view of the instrument, still some known characteristics can be seen: • O3 concentrations show a decrease with latitude near 40 km altitude. In the lower latitudes O3 is generated by photolysis of O2. • In the middle stratosphere (25-30 km) O3 is strongly influenced by transport effects. Strong transport towards South region is visible in middle and higher latitudes. • The lower stratosphere shows an O3 increase with latitude. Highest values can be found within higher latitude regions due to downward transport of rich air masses. The monitoring of the level 2 products consists in the check of the processing consistency, format integrity and scientific reliability of the atmospheric data. One interesting section of the L2 daily report is presented in Fig.3 showing the Ozone profiles, from left to right the first plot shows all values including outliers, the second is a zoom on the stratospheric peak and the last on the mesospheric peak. Similar figures are reported for different standard deviations. Long term analysis • In addition to the daily monitoring which is aimed at the quick detection of instrument and products anomaly a systematic long term analysis is carried out on a monthly basis and a report is delivered to the user community. • The MR is issued with the support of the QWG, the report contains information about: • Mission status and instrument planning • Processing Status and Configuration on the Ground Segments • Products quality monitoring and long term analysis • Anomaly reporting and investigation • The main results of the GOMOS MR are the long term analysis of the instrument status and performances, the long term trend of the gain and spectral calibration and the mispointing evolution. The analysis of significant instrument parameters on a long term basis is important in order to study long term trend or seasonal variation and for detecting instrument ageing. Source of information Data quality disclaimers provide information on known deficiencies in processing, and on transient degradations not yet compensated http://envisat.esa.int/dataproducts/availability/disclaimers/ Daily/monthly reports can be accessed at: http://earth.esa.int/pcs/envisat/gomos/reports/ The unavailability intervals of the GOMOS instrument are available on line http://envisat.esa.int/instruments/availability/ For any questions on GOMOS, please contact ESA’s EO Helpdesk eohelp@esa.int