Download

1 / 23
240 likes | 514 Vues
Direct Variation. What is it and how do I know when I see it?. What is a Direct Variation or a Direct Proportion?. Used to compare two values and to see how one value affects the other value

E N D
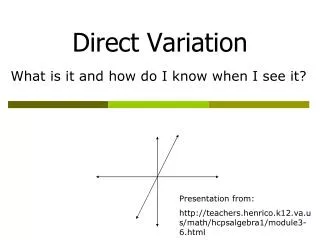
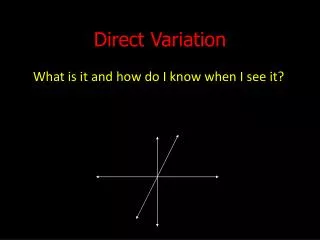
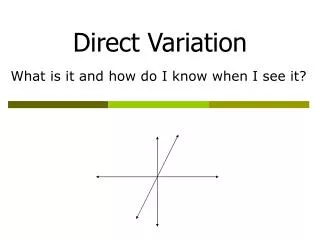
Direct Variation What is it and how do I know when I see it?
What is a Direct Variation or a Direct Proportion? • Used to compare two values and to see how one value affects the other value • When 1 quantity always changes by the same factor (the constant) as another, the 2 quantities are in direct proportion. The 2 quantities always have equivalent ratios
How do we find know if we have a direct variation? • You can look at: 1. EQUATIONS 2. TABLES 3. GRAPHS to see how two values affect one another
Direct Variation Equations: • Y varies directly as x means that y = kx • where k is the constant of variation. • Another way of writing this is k = • X is the independent variable • Y is the dependent variable • K is the constant of proportionality
Examples of Direct Variation Equations (y = kx)… • y = 4x k = 4 • y = x k = 1 • y = 2x k = 2 • y = 2.5x k = 2.5 • y = ⅝ x k = ⅝ • y = 0.75x k = 0.75
Direct Variation & Tables of Values You can make a table of values for “x” and “y” and see how the values behave. You could have a direct variation if… • As “x” increases in value, “y” also increases in value OR • As “x” decreases in value, “y” also decreases in value
Examples of Direct Variation: Note: As “x” increases, 6 , 7 , 8 “y” also increases. 12, 14, 16 What is the constant of variation of the table above? Start with the direct variation equation: y = kx Pick one pair of x and y values and substitute into the equation 12 = k · 6 (this is a one-step equation, so solve for k) 12/6 = k → k = 2 Now you can write the equation for this direct variation: y = 2x
Examples of Direct Variation: Note: X decreases, 30, 15, 9 And Y decreases. 10, 5, 3 What is the constant of variation of the table above? Start with the direct variation equation: y = kx Pick one pair of x and y values and substitute into the equation 10 = k · 30 (this is a one-step equation, so solve for k) 10/30 = k → (simplify 10/30) → k = ⅓ Now you can write the equation for this direct variation: y = ⅓ · x
Is this a direct variation? If yes, give the constant of variation (k) and the equation. • Yes! • y = kx • Pick an x & y pair and substitute into the direct variation equation to solve for k. • Remember the constant must hold true for every x,y pair • 6 = k · 4 • k = 6/4 = 3/2 = 1 ½ • Therefore the equation for this table is: y = 1 ½ · x
Is this a direct variation? If yes, give the constant of variation (k) and the equation. Yes! y = kx * Pick an x & y pair and substitute into the direct variation equation & find k. 25 = k · 10 25/10 = k 5/2 or 2 ½ = k * Remember the constant must hold true for every x,y pair. Therefore the equation for this table is: y = 2 ½ · x
Is this a direct variation? If yes, give the constant of variation (k) and the equation. No! If you look at the values in the table, you should notice as “x” decreases, “y” increases, so you know you CANNOT have a direct variation! Also, there is no constant of proportionality. There is not one number you multiply by x to get y for each pair in the table.
Answer Now Which is the equation that describes the following table of values? • y = -2x • y = 2x • y = ½ x • xy = 200
Using Direct Variation to find unknowns (y = kx) Given y varies directly with x, and y = 28 when x=7, Find x when y = 52. HOW??? 2 step process 1. Find the constant of variation y = kx → 28 = k · 7 (divide both sides by 7) k=4 2. Use y = kx. Find the unknown (x). 52= 4x or 52/4 = x x= 13 Therefore: X =13 when Y=52
Using Direct Variation to find unknowns (y = kx) Given that y varies directly with x, and y = 3 when x=9, Find y when x = 40.5. HOW??? 2 step process 1. Find the constant of variation. Y = kx → 3 = k · 9 (divide both sides by 9) K = 3/9 = 1/3 2. Use y = kx. Find the unknown (x). y= (1/3)40.5 y= 13.5 Therefore: X =40.5 when Y=13.5
Real World Examples of Direct Variation Situations… • The more time I drive at a constant rate, the more miles I go. • If I increase a recipe for more people, the more of an ingredient I need. • The more hours I work, the more money I make. • The more CD’s I purchase, the more money it costs. • The less cheese I buy at the deli, the less money I pay.
Using Direct Variation to solve word problems Problem: A car uses 8 gallons of gasoline to travel 290 miles. How much gasoline will the car use to travel 400 miles? Step One: Find points in table Step Three: Use the equation to find the unknown. 400 =36.25x 400 =36.25x 36.25 36.25 or x = 11.03 Step Two: Find the constant of variation and equation: y = kx → 290 = k · 8 290/8 = k y = 36.25 x
Using Direct Variation to solve word problems Problem: Julio wages vary directly as the number of hours that he works. If his wages for 5 hours are $29.75, how much will they be for 30 hours Step One: Find points in table. Step Three: Use the equation to find the unknown. y = kx y = 5.95 ·30 y = 178.50 Step Two: Find the constant of variation. y = kx → 29.75 = k · 5 k = 5.95
Characteristics of Direct Proportion Graph… • The graph will always go through the ORIGIN (point 0,0) on the coordinate plane) & will be in Quadrants I and III only (for this year we’re only required to graph in Quadrant I – all positive numbers) • The graph will always be a straight line • As the “x” values increase, the “y” value will also increase
Independent VS. Dependent • The x-axis is the independent variable; this means it does NOT depend on the y value • The y-axis is the dependent variable; this means it DOES depend on the x variable for its value.
Example… • You went on a hiking trip, and you graphed your distances at various times throughout your trip. As the time you hiked increased, the distance traveled also increased. The distance depends on the time; therefore, the distance is the dependent variable and it is graphed on the y-axis (vertical). The time is independent (time still goes on whether or not the distance changes), so it is graphed on the x-axis (horizontal).
Tell if the following graph is a Direct Variation or not. No No No No
Tell if the following graph is a Direct Variation or not. Yes No No Yes