Download
1 / 31
310 likes | 544 Vues
Review Sistem Persediaan Independent Demand. Overview. What is an inventory system and why hold stock? Textbook prescriptions versus reality and variety? Independent versus Dependent Demand Inventory types, flows, costs Re-order quantities, EOQ & calculations

E N D
Overview • What is an inventory system and why hold stock? • Textbook prescriptions versus reality and variety? • Independent versus Dependent Demand • Inventory types, flows, costs • Re-order quantities, EOQ & calculations • Safety stocks & service levels • Review systems • Discounts and staged deliveries • JIT • ABC Analysis • Stock taking • Make or buy
What is an Inventory System? Inventory • the stock of any item or resource used in an organization: raw materials, finished products, component parts, supplies and work-in-process. An inventory system • policies and controls for monitoring levels of inventory • Information system that records transactions and enables analysis of stock requirements and levels/quantities, costs etc
Organisations, Roles, Methods and Systems? • What type of organisations use systematic inventory management methods? • How are the methods manifested? • How is inventory management linked to • aggregrate planning, buying for MRP, JIT, retail buying, sales systems, accounting practice? • Who does it? • buyers, store keepers, production planners, accountants? • What manual & IT-based systems are involved? • Stock cards, orders, delivery notes, GRNs, return advice notes, inventory module in integrated accounting packages, stock checks and auditing. • Are textbook methods really used? How, where? • What is the clerical burden of inventory analysis and control?
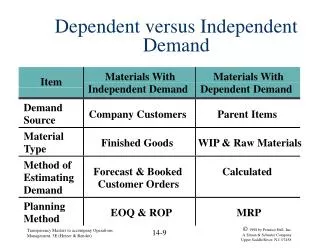
Independent vs. Dependent Demand Independent Demand (not related to other items or final end-product) Dependent Demand (derived from component parts, sub-assemblies, raw materials, etc.) E(1)
Dependent demand Work in progress Components and raw materials Independent demand - finished goods - spare parts Demand/usage Demand/usage Time Time Independent versus Dependent Demand
Why hold stock? • Provide flexibility • minimum delay in supplying customers • a good range • Protect against uncertainties • Enable economic purchasing • Anticipate changes in demand or supply • Buffers to feed processes and enable efficient scheduling • Strategic stock holdings
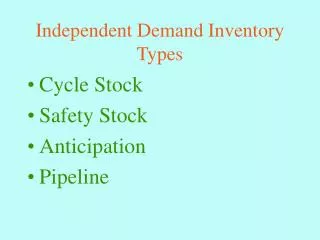
Inventory Types • Raw-materials, components and sub-assemblies • Work-in-progress or in-transit • Finished-goods • In the warehouse, awaiting shipment, in delivery vehicles, in tanks, on shelves, in the stores • Strategic inventory • Scrap & re-work
Material-Flows Process Production Processes Work in process To Customer Stores warehouse Finished goods WIP From Suppliers WIP Inventory in transit
Stock : Input (Flow in), Storage (Holding) and Flow out (Usage) Inventory Level Supply Rate Stock Level Rate of Demand (Usage)
annual costs • = holding cost factor % • average value of stockholding e.g. 25% or 2p in £ per month of stock Costs of Inventory • Ordering costs • purchase order & office, shipping and/or set up • Holding Costs • tied up capital (item value), staff & equipment, obsolescence, perishability, shrinkage, insurance & security, m2 - m3 (rent/lease), audit. • Cost of being out of stock, cancelling an order • Scrap and re-working
Order Quantities & Reorder Points Average stock q/2 No. of units on hand q q safety or buffer level R L L Time R = Reorder point L = Lead time
<=ROL? Due now? Outstanding Order? Simple inventory system Next Check point Orders MRP Check stock level No Yes No Yes Yes Receive/inspect. Accept into stock Send back? Part-delivery No Raise order for ROQ
Bin systems Two-Bin - quantity stock in bin 2 = re-order level Order one bin Full Empty One-Bin (periodic check) Order enough to refill bin? • ROQ Options • Keep order costs to a minimum? • Order one year's supply in one go? OR • Hand-to-mouth, once per week?
Total Cost Holding Costs Ordering Costs Qeoq Order Quantity (Q) EOQ Aim = Cost Minimisation Holding + ordering costs = total cost curve. Find Qeoq inventory order point to minimise total costs. Cost
Economic Order Quantity (EOQ) Assumptions • Single product line • Demand rate: recurring, known, constant • Lead time: constant , known • No quantity discounts - stable unit cost • No stock-outs allowed • Items ordered/produced in a lot or batch • Batch received all at once • Holding cost is linear based on average stock level • Fixed order + set up cost
2200 2000 Actual lead time is 3 days! (at day 21) Dip into safety stock Order Point Units 400 200 Safety Stock 0 18 21 Days Order Point with Safety Stock
Safety Stock and Re-order Levels • Reserve - buffer - cushion against uncertain demand (usage) & lead time. • A basis for a "2-bin" system • Application to JIT? EOQ assumes certain demand & lead time. If uncertain, then: ROL = Average usage in lead time + safety stock (Avg. lead time x Avg. daily usage)
How Much Safety Stock? Cost vs. safety level • Depends on: • Uncertainty: demand & lead time • cost of • being out of stock • carrying inventory • increasingly better service Service level policy • % confidence of not hitting a stock-out situation
Cost vs service level • Cost of poor service (out-of-stock) • Loss of • part order • future order • customer goodwill • buying from non-regular sources £ Cost of better and better service 0 70 80 90 100 % Service level
Normal Distribution of Demand over Lead Time m = mean demand r = reorder point s = safety stock service level probability frequency probability of stock out m s r demand over lead time
Service level protection Confidence of % non –stock out K = 2 for 97.5 confidence K = 3 for 99.87 • ROL = Average usage in lead time + Safety stock (Avg. usage (day/week) x Avg. Lead time) K x stdev demand x Avg. lead time
ROL AND Service Level Example • ROL = Average usage in lead time + Safety stock (Avg. usage … day/week x Avg. lead time) K x stdev demand x Avg. lead time • ROL = (250 per week x 4 weeks) + ( 2 x 50 x (4) ) = 1000 + 200 = 1200 Stock falls to or below ROL & no order is outstanding? Place a new order for 1200. Service level @ 97.5% stock-out for 1 in 40 reorder situations.
Review Systems • Top-up with regular review • Stock not to exceed upper limit (perishables, corrosives, limited capacity) • use with – regular review (continuous or periodic) • Continuous review • relax “constant demand” assumption • Continuous system to monitor “stock-on-hand” • Periodic review • Apply EOQ (demand constant + “no stock-out”) • orders must be placed at specified intervals. • Use when multiple, items ordered from same supplier (joint-replenishment) • inexpensive items
Price discounts and staged deliveries • Quantity Discounts, buyingfrequency & Oc, Hc • more storage space • different payment terms • if demand changes – surplus stock • Staged deliveries & EOQ? • Extra delivery & handling cost? • Assumes constant order cost • Requires reliable deliveries & steady demand • JIT – collaborative supplier relationships • Affect on supplier (locate nearer customer?)
U-shaped function True Qopt values occur at the start of each price-break interval.The total annual cost function is a “u” shaped function Total annual costs Price-breaks 0 1826 2500 4000 Order Quantity
Just-in-Time • approach to inventory management & control in which inventories are acquired & inserted in production at exact time when needed. • Requirement • Accurate production & inventory information system • Highly efficient purchasing • Reliable suppliers • Efficient inventory-handling system
ABC - 20/80 Principle and Inventory Control Items not of equal importance: • £ invested & profit potential • Sales/usage volume • stock-out penalties • Control expensive items closely. • “A” items – review frequently • Review “B” & “C” items frequently. 100 90 70 Cumulative Percentage of Inventory Value C B A 0 15 45 100 Pareto - 20/80 Principle Identify inventory items based on % of total £ value. “A” items top 20 %, “B” next 40 %, "C" the lower 20%. Cumulative %
ABC Chart 45% 120% A B C 40% 100% 35% 30% 80% Cumulative % Cumulative % Usage Percent Usage 25% 60% 20% 15% 40% 10% 20% 5% 0% 0% 3 6 9 2 4 1 10 8 5 7 Item No.
Stock Check • Book stock vs physical stock • Stock valuation – wastage & shrinkage • Audit stock security systems • Organising the stock check • Internal & external audit • Segmentation of duties