Download
1 / 18
180 likes | 187 Vues
Psychological factors, stock price paths, and trading volume. Steven Huddart (Penn State), Mark Lang (UNC Chapel Hill), and Michelle Yetman (UIowa) Discussed by Andrei Simonov (Stockholm School of Economics). Why should we care?.

E N D
Psychological factors, stock price paths, and trading volume Steven Huddart (Penn State), Mark Lang (UNC Chapel Hill), and Michelle Yetman (UIowa) Discussed by Andrei Simonov (Stockholm School of Economics)
Why should we care? • Disposition effect: reference point is purchase price of the stock (Shefrin & Statman (85), Odean 98) • Note: disposition effect tends to disappear within ~ 240 trading days (Jackson, 2002) • Search story: small investors are net purchasers on the days when stock is in the news (Barber& Odean 2002) • Option exercise literature: Heath, Huddard and Lang (99), Core & Guay (01), Potesman & Serbin (01) • Ferris, Haugen & Makhija: trading volume is higher when firm pass previous ”high price”
This paper... • Builds on Ferris et. al. • Convincingly documents the association between extreme points in past price path and market volume • Suggests the association between behavioral factors and trading volume
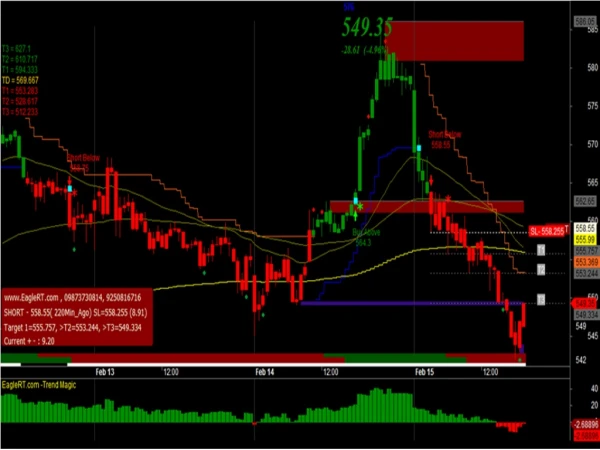
What is the idea? Investors who bought in May-June 01, are more likely to sell when the next high is hit (May-June 2002) AMEX:ECO
Volume Leaders: NASDAQ | AMEX | NYSEPrice % Gainers: NASDAQ | AMEX | NYSEPrice % Losers: NASDAQ | AMEX | NYSE
How is it done? • Weekly data in randomly chosen 1000 companies (why not all???? Possible biases as firms tend to be small), NYAM &NASDAQ • Variables of interest: • PRIORMAX dummy • LHIGH=PRIORMAX*MONTH SINCE PREV. HIGH • Volume: measured as turnover or ”abnormal” turnover. • Control for ex-div and earning announcement dates, price($ and relative), etc.
Model • Essentially, the model estimated is reminiscent of VAR with contemporaneous exogenous variables: b is STRONGLY significant, Min(t-stat)=14
Critique(1): Logic • Investors want to sell when the price reaches new high • The more sophisticated investors are, the more prone they are to behavioral biases (Huddart & Lang 02, Poteshman & Servin, 01) • But... Barber & Odean 02: Unsophisticated investors are net buyers on stock news date • It seems that constant supply of suckers is necessary to support the story
Critique: Econometric • Why not full-fledged VAR with past turnover? • Why weekly returns? Is it possible that we are missing real max? • Why raw returns? What would happen if returns are adjusted for market and especially for momentum? Example: CYPB (CYPRESS BIOSCI)
What are alternative explanations? • Barber & Odean 2002: news story. • Essentially it says that effect of 52 weeks high is self-reinforcing. • Investors are buying stock which was in the news • But being in max. is equivalent in being on the news (both in High/Low section and on Lou Dobbs’ Moneyline, CNBC Power Lunch, etc.)
Can we test for alternative explanations? • My small sample • 4 month of daily data Feb-May 2000: • Returns (both raw and market-adjusted), volume, dividend payouts, etc. • Press releases dummy (=1 if release was issued on that date) • Number of times the company was mentioned in the press/in TV news, etc. (daily) • 59 Swedish companies
Measures of press exposure • I am using abnormal exposure measured as residual of regression of number of hits on • Log10(MktCap), press releases dummy (same day and lagged), industry dummies, day of week dummies, market index return, in different combinations (does not affect results) • Similar to the measure of abnormal analyst’ coverage.
Results(2) • No causality between PRIORMIN, PRIORMAX and either TO or returns • Causality from PRIORMAX to EXPOSURE • Stronger for raw returns (p=0.005), weaker for market adjusted returns • Strong bi-directional causality between exposure and turnover • Strong causality from returns to exposure, weaker one from exposure to returns (but still stat. signif. on 5% level, stronger for market-adjusted returns)
Results(3) • PRIORMAX is important, PRIORMIN is not. May be, disposition effect? • How to understand Huddart-Lang-Yetman? As chain PRIORMAXExposure Turnover • Exposure effect is stronger and on short time horizon can even drive returns. • So, it is still behavioral, but… Not on sellers’ but on buyers’ side.
Net picking: AMEX:ECOAverage analyst’ ranking ~4/5 (run away!), worst CAN Au firm ”Au prices rising…Money is flowing into gold stocks.” Reuters, May 17 3-way merger announced, Fidelity increases stake Credit Crunch, fire sale, S&P downgrade to B- First merger rumors on Reuters