Download
1 / 18
180 likes | 337 Vues
Capital Budgeting - Measuring Investment Returns. 6 th June 2014. Enhancing Shareholder Value. The corporate strategy is tuned to maximize the return to the shareholders. Operating & Investment Decisions. Financing & Funding Decisions. Value to Shareholders. Cash Flow.

E N D
Capital Budgeting - Measuring Investment Returns 6th June 2014
Enhancing Shareholder Value The corporate strategy is tuned to maximize the return to the shareholders Operating & Investment Decisions Financing & Funding Decisions Value to Shareholders Cash Flow Cost of Capital
Shareholder Value Analysis Key decisions impacting Shareholder Value • Investment Strategy • Invest only when the asset is expected to earn more than the minimum acceptable return ( hurdle rate ) • Capital Investments , Acquisitions & Working Capital • Financing Strategy • Capital Structure to optimize the cost of capital • Borrowing Strategy & credit rating • Pay-out Strategy • Combination of incremental dividend and plough back for capital appreciation
Shareholder Value – First Principles Invest only when the asset is expected to earn more than the minimum acceptable return ( hurdle rate ) • Return on projects to be measured based on cash flows generated and the timing of these cash flows • Choose a financing mix which minimizes the hurdle rate If there is not enough investment opportunities then Pay-out to shareholders
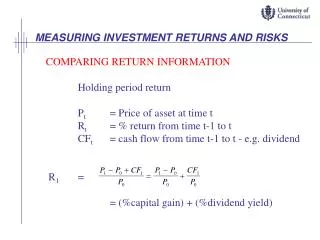
Measuring Returns Right Convert Accounting Earnings to Cash Flows • Add back Non cash expenses ( like depreciation, provisions, loss on disposal of assets etc ) • Subtract out non cash incomes (like accrued income ) • Subtract out cash flows , which are not expensed ( such as capital expenditure ) • Consider changes in working capital to make accrual revenues and expenses in to cash revenues and expenses Use “Incremental Cash Flows” ,duly “ Time weighted” returns ( cash flow generated in near time to be valued higher )
The Basics of Risk • Specific Risks : Variability in the return due to factors unique to a Project/ Company , having impact on sales and earnings • Operational Risks associated with the projects • Environmental & other political-socio risks • Regulatory regime capping the returns • Systematic Risk : Variability in the return due to factors that influence return on all traded security • Macro economic conditions • Swings in Interest Rates & Exchange Rates
The Basics of Risk Systematic Risk is measured by Beta Beta establishes relationship between the excess returns of an individual asset to that of the market portfolio , where the beta of the market portfolio is 1 Beta is the covariance of the asset with the market divided by the variance of market portfolio Covariance measures the tendency of any pair of random variables to move together Assets having betas in excess of 1 are riskier than the market portfolio and vice versa
Cost of Capital We source capital needs from both equity and debt Cost of equity ( Ke) = Risk free return + Risk premium* beta => R f + beta ( Rm- Rf) Where R f = Risk free rate R m = Expected Return on market portfolio Cost of Debt => Post tax cost of debt = Interest Rate * ( 1- tax rate ) Wtd Avg Cost of Capital =( Proportion of debt* Post tax Interest Rate ) + (Proportion of Sh. Capital* Ke) WACC ( .70 gearing) = [0.70*10%* (1-.3399)] + (0.30*20 % ) = 10.62 %
Measuring Returns ( ROC) After Tax ROC =EBIT( 1-Tax Rate ) / ( BV of Debt + BV of Equity).( calculate this from available data of the most recent periods) Return Spread = After Tax ROC- Cost of Capital EVA = Return Spread (BV of Debt + BV of Equity)
Capital AllocationRules Cost of Capital represents the hurdle rate of the firm to which project specific risk premium is added to arrive at project specific hurdle rate Expected Return on Capital > Cost of Capital ( Project is viable ) Pay back Period is a measure of how quickly the cash flows generated can cover the initial investment
DCF – as a measure of return Cash flows across the time horizon cannot be added , hence to be brought to the Present Value Discounted Cash Flow measure ( NPV ) Cash flow over the life of the project including the initial investment is discounted at Hurdle rate If NPV > 0 accept the project For competing projects , select the project with highest NPV
DCF – as a measure of return The internal rate of return method finds the interest yield of the potential investment. This is the interest rate that will cause the present value of the proposed capital expenditure to equal the present value of the expected annual cash inflows. Increase the discount rate till NPV reaches “0” If IRR > Cost of Capital ( Accept the Project)
DCF – as a measure of return Profitability Index : It is the ratio of the present value of cash flows to present value of initial investments PI = NPV of Cash Flows / PV of Outlays If PI > 1 , accept the project Accept Project A
Projects S and L are mutually exclusive, and will be repeated. If k = 10%, which is better? Expected Net CFs Year Project SProject L 0 (Rs100000) (Rs100,000) 1 59,000 33,500 2 59,000 33,500 3 - 33,500 4 - 33,500 Evaluating projects with unequal lives
Calculate the NPV of both the Projects S & L • NPV_ Project S= Rs. 2,179 • NPV of Project L = Rs.5,628 • Is Project L always better - NO? • Need to perform replacement chain analysis , as it unfair to compare to projects with unequal lives Evaluating projects with unequal lives 0 1 2 3 4 10% -100,000 59,000 59,000 59,000 59,000 -100,000 -41,000
Equity Analysis Here the returns , cash flows and hurdle rates are defined entirely from the point of view of equity investors Accounting Return ( ROE) = PAT/ BV of Equity Under DCF method , ROE = Residual Cash Flows – Debt Repayment ( Use hurdle rate for cost of equity)
Why Capital Rationing ? • Internal capital markets • Costly (time-consuming ) • Regulatory Framework • “Strategic direction” of firm • Access to external capital markets is imperfect. • Expensive (float costs, etc.) • Informational asymmetry issues. 28