Download
1 / 62
620 likes | 742 Vues
AP BIOLOGY BIG IDEA #1 – Part A – Section 3. Evolutionary Change is Random. Concept 23.3: Natural selection, genetic drift, and gene flow can alter allele frequencies in a population. Three major factors alter allele frequencies and bring about most evolutionary change: Natural selection

E N D
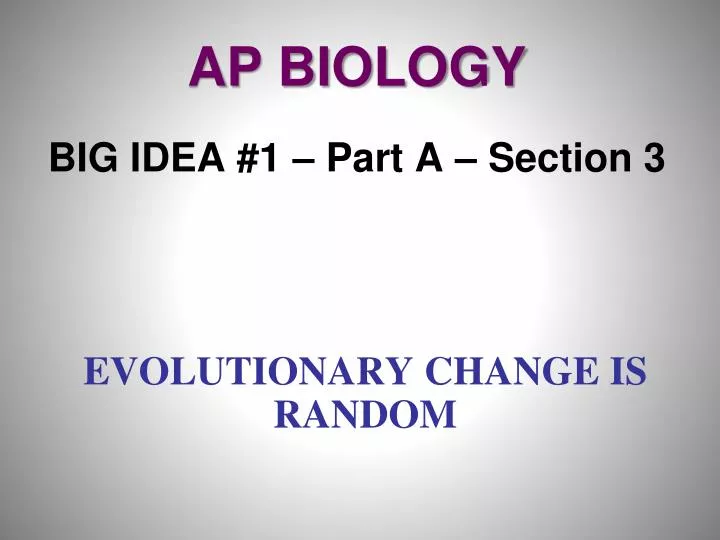
AP BIOLOGY BIG IDEA #1 – Part A – Section 3 Evolutionary Change is Random
Concept 23.3: Natural selection, genetic drift, and gene flow can alter allele frequencies in a population • Three major factors alter allele frequencies and bring about most evolutionary change: • Natural selection • Genetic drift • Gene flow
Natural Selection • Differential success in reproduction results in certain alleles being passed to the next generation in greater proportions
Genetic Drift • The smaller a sample, the greater the chance of deviation from a predicted result • Genetic drift describes how allele frequencies fluctuate unpredictably from one generation to the next • Genetic drift tends to reduce genetic variation through losses of alleles Animation: Causes of Evolutionary Change
Fig. 23-8-1 CR CR CR CR CR CW CR CR CW CW CR CW CR CR CR CW CR CR CR CW Generation 1 p (frequency of CR) = 0.7 q (frequency of CW) = 0.3
Fig. 23-8-2 CW CW CR CR CR CR CR CR CR CW CR CW CR CR CW CW CW CW CR CR CR CW CR CW CW CW CR CR CR CW CR CR CR CW CR CW CR CR CR CW Generation 1 Generation 2 p (frequency of CR) = 0.7 p = 0.5 q (frequency of CW) = 0.3 q = 0.5
Fig. 23-8-3 CW CW CR CR CR CR CR CR CR CR CR CW CR CW CR CR CR CR CR CR CR CR CR CR CW CW CW CW CR CR CR CW CR CR CR CR CR CW CR CR CW CW CR CR CR CW CR CR CR CR CR CR CR CW CR CW CR CR CR CW Generation 1 Generation 2 Generation 3 p (frequency of CR) = 0.7 p = 1.0 p = 0.5 q (frequency of CW) = 0.3 q = 0.0 q = 0.5
The Founder Effect • The founder effectoccurs when a few individuals become isolated from a larger population • Allele frequencies in the small founder population can be different from those in the larger parent population
The Bottleneck Effect • The bottleneck effectis a sudden reduction in population size due to a change in the environment • The resulting gene pool may no longer be reflective of the original population’s gene pool • If the population remains small, it may be further affected by genetic drift
Fig. 23-9 Bottlenecking event Surviving population Original population
Case Study: Impact of Genetic Drift on the Greater Prairie Chicken • Loss of prairie habitat caused a severe reduction in the population of greater prairie chickens in Illinois • The surviving birds had low levels of genetic variation, and only 50% of their eggs hatched
Fig. 23-10 Post-bottleneck (Illinois, 1993) Pre-bottleneck (Illinois, 1820) Range of greater prairie chicken (a) Percentage of eggs hatched Number of alleles per locus Population size Location Illinois 5.2 3.7 93 <50 1930–1960s 1,000–25,000 <50 1993 Kansas, 1998 (no bottleneck) 750,000 5.8 99 Nebraska, 1998 (no bottleneck) 75,000– 200,000 5.8 96 Minnesota, 1998 (no bottleneck) 5.3 85 4,000 (b)
Fig. 23-10a Post-bottleneck (Illinois, 1993) Pre-bottleneck (Illinois, 1820) Range of greater prairie chicken (a)
Fig. 23-10b Number of alleles per locus Percentage of eggs hatched Population size Location Illinois 93 <50 5.2 3.7 1930–1960s 1,000–25,000 <50 1993 Kansas, 1998 (no bottleneck) 99 750,000 5.8 75,000– 200,000 Nebraska, 1998 (no bottleneck) 5.8 96 Minnesota, 1998 (no bottleneck) 4,000 5.3 85 (b)
Researchers used DNA from museum specimens to compare genetic variation in the population before and after the bottleneck • The results showed a loss of alleles at several loci • Researchers introduced greater prairie chickens from population in other states and were successful in introducing new alleles and increasing the egg hatch rate to 90%
Effects of Genetic Drift: A Summary • Genetic drift is significant in small populations • Genetic drift causes allele frequencies to change at random • Genetic drift can lead to a loss of genetic variation within populations • Genetic drift can cause harmful alleles to become fixed
Gene Flow • Gene flowconsists of the movement of alleles among populations • Alleles can be transferred through the movement of fertile individuals or gametes (for example, pollen) • Gene flow tends to reduce differences between populations over time • Gene flow is more likely than mutation to alter allele frequencies directly
Examples of Gene flow that can decrease the fitness of a population: • In bent grass, alleles for copper tolerance are beneficial in populations near copper mines, but harmful to populations in other soils • Windblown pollen moves these alleles between populations • The movement of unfavorable alleles into a population results in a decrease in fit between organism and environment
Fig. 23-12 70 MINE SOIL NON- MINE SOIL NON- MINE SOIL 60 50 Prevailing wind direction Index of copper tolerance 40 30 20 10 0 20 0 20 120 160 20 0 40 80 140 60 100 Distance from mine edge (meters)
Fig. 23-12a 70 NON- MINE SOIL MINE SOIL NON- MINE SOIL 60 50 Prevailing wind direction 40 Index of copper tolerance 30 20 10 0 160 20 0 100 120 0 20 20 40 60 80 140 Distance from mine edge (meters)
Examples of Gene flow that can increase the fitness of a population: • Insecticides have been used to target mosquitoes that carry West Nile virus and malaria • Alleles have evolved in some populations that confer insecticide resistance to these mosquitoes • The flow of insecticide resistance alleles into a population can cause an increase in fitness
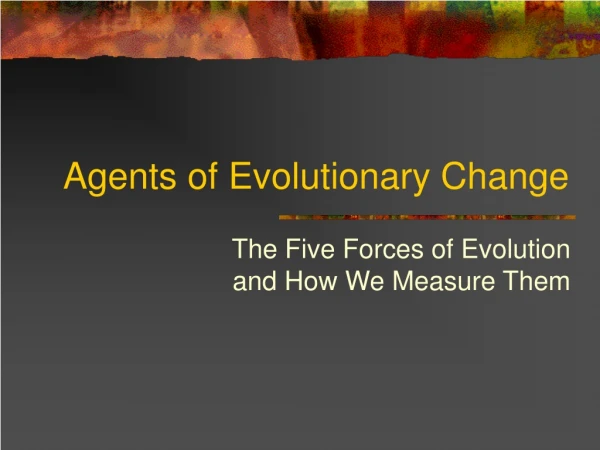
Concept 23.4: Natural selection is the only mechanism that consistently causes adaptive evolution • Only natural selection consistently results in adaptive evolution
A Closer Look at Natural Selection • Natural selection brings about adaptive evolution by acting on an organism’s phenotype
Relative Fitness • The phrases “struggle for existence” and “survival of the fittest” are misleading as they imply direct competition among individuals • Reproductive success is generally more subtle and depends on many factors
Relative fitnessis the contribution an individual makes to the gene pool of the next generation, relative to the contributions of other individuals • Selection favors certain genotypes by acting on the phenotypes of certain organisms
Directional, Disruptive, and Stabilizing Selection • Three modes of selection: • Directional selection favors individuals at one end of the phenotypic range • Disruptive selection favors individuals at both extremes of the phenotypic range • Stabilizing selection favors intermediate variants and acts against extreme phenotypes
Fig. 23-13 Original population Frequency of individuals Phenotypes (fur color) Original population Evolved population (b) Disruptive selection (c) Stabilizing selection (a) Directional selection
Fig. 23-13a Original population Frequency of individuals Phenotypes (fur color) Original population Evolved population (a) Directional selection
Fig. 23-13b Original population Frequency of individuals Phenotypes (fur color) Evolved population (b) Disruptive selection
Fig. 23-13c Original population Frequency of individuals Phenotypes (fur color) Evolved population (c) Stabilizing selection
The Key Role of Natural Selection in Adaptive Evolution • Natural selection increases the frequencies of alleles that enhance survival and reproduction • Adaptive evolution occurs as the match between an organism and its environment increases
Fig. 23-14 (a) Color-changing ability in cuttlefish Movable bones (b) Movable jaw bones in snakes
Fig. 23-14a (a) Color-changing ability in cuttlefish
Fig. 23-14b Movable bones (b) Movable jaw bones in snakes
Because the environment can change, adaptive evolution is a continuous process • Genetic drift and gene flow do not consistently lead to adaptive evolution as they can increase or decrease the match between an organism and its environment
Sexual Selection • Sexual selectionis natural selection for mating success • It can result in sexual dimorphism, marked differences between the sexes in secondary sexual characteristics
Intrasexual selectionis competition among individuals of one sex (often males) for mates of the opposite sex • Intersexual selection, often called mate choice,occurs when individuals of one sex (usually females) are choosy in selecting their mates • Male showiness due to mate choice can increase a male’s chances of attracting a female, while decreasing his chances of survival
How do female preferences evolve? • The good genes hypothesis suggests that if a trait is related to male health, both the male trait and female preference for that trait should be selected for
Fig. 23-16 EXPERIMENT Female gray tree frog SC male gray tree frog LC male gray tree frog SC sperm Eggs LC sperm Offspring of SC father Offspring of LC father Fitness of these half-sibling offspring compared RESULTS Fitness Measure 1995 1996 NSD LC better Larval growth NSD LC better Larval survival Time to metamorphosis LC better (shorter) LC better (shorter) NSD = no significant difference; LC better = offspring of LC males superior to offspring of SC males.
Fig. 23-16a EXPERIMENT Female gray tree frog LC male gray tree frog SC male gray tree frog SC sperm Eggs LC sperm Offspring of LC father Offspring of SC father Fitness of these half-sibling offspring compared
Fig. 23-16b RESULTS Fitness Measure 1996 1995 LC better NSD Larval growth Larval survival NSD LC better Time to metamorphosis LC better (shorter) LC better (shorter) NSD = no significant difference; LC better = offspring of LC males superior to offspring of SC males.
The Preservation of Genetic Variation • Various mechanisms help to preserve genetic variation in a population
Diploidy • Diploidy maintains genetic variation in the form of hidden recessive alleles
Balancing Selection • Balancing selectionoccurs when natural selection maintains stable frequencies of two or more phenotypic forms in a population
Heterozygote Advantage • Heterozygote advantage occurs when heterozygotes have a higher fitness than do both homozygotes • Natural selection will tend to maintain two or more alleles at that locus • The sickle-cell allele causes mutations in hemoglobin but also confers malaria resistance
Fig. 23-17 Frequencies of the sickle-cell allele 0–2.5% 2.5–5.0% 5.0–7.5% Distribution of malaria caused by Plasmodium falciparum (a parasitic unicellular eukaryote) 7.5–10.0% 10.0–12.5% >12.5%
Frequency-Dependent Selection • In frequency-dependent selection, the fitness of a phenotype declines if it becomes too common in the population • Selection can favor whichever phenotype is less common in a population