Download
1 / 12
140 likes | 357 Vues
Reciprocity. Reciprocity – measures the extent to which a tie from A to B is reciprocated by a tie from B to A. Obtained for directed (asymmetric) ties. Networks with lots of reciprocity are often more balanced, stable, harmonious. Different ways to measure reciprocity : Dyad based

E N D
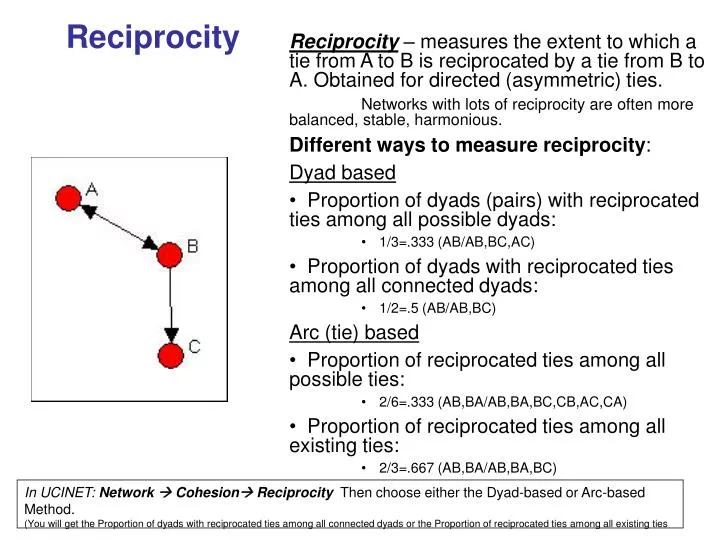
Reciprocity Reciprocity – measures the extent to which a tie from A to B is reciprocated by a tie from B to A. Obtained for directed (asymmetric) ties. Networks with lots of reciprocity are often more balanced, stable, harmonious. Different ways to measure reciprocity: Dyad based • Proportion of dyads (pairs) with reciprocated ties among all possible dyads: • 1/3=.333 (AB/AB,BC,AC) • Proportion of dyads with reciprocated ties among all connected dyads: • 1/2=.5 (AB/AB,BC) Arc (tie) based • Proportion of reciprocated ties among all possible ties: • 2/6=.333 (AB,BA/AB,BA,BC,CB,AC,CA) • Proportion of reciprocated ties among all existing ties: • 2/3=.667 (AB,BA/AB,BA,BC) In UCINET: Network Cohesion Reciprocity Then choose either the Dyad-based or Arc-based Method. (You will get the Proportion of dyads with reciprocated ties among all connected dyads or the Proportion of reciprocated ties among all existing ties
A A A A A A Fig. 2. Fig. 1. Fig.3. Fig.5. Fig.4. Fig.6. B B B B B B C C C C C C Transitivity measures a tendency for a tie from A to C to exist if a tie from A to B and a tie from B to C exist. If A B & B C & A C then the three are transitive. Networks with high level of transitivity are often more stable, balanced, harmonious. Suppose we have symmetric ties, transitivity then means that If A is friends with B and B is friends with C (suppose that friendship is always symmetric) A is friends with C (Fig.1). (In other words: the triad is closed.)AB, B C, AC In that case, however, it is also true that if A is friends with C and C is friends with B, A is friends with B.AC, CB, AB Four other statements also must be true: BA, AC, BC & BC, CA, BA & CA, AB, CB & CB, BA, CA This triad is fully transitive: you can take the three nodes in any configuration, you will get transitivity. Any particular configuration of three nodes is called a triple. Three nodes can form triples (3*2*1=) 6 different ways: ABC, ACB, BAC, BCA, CAB, CBA Suppose we have directedties, but all happen to be reciprocal (Fig.2.). We have the same results as with symmetric ties. Indeed, all triples are transitive. Now C is friend of A but A is NOT friend of C. How many transitive triples do we have left? Only 3 BC, CA, BA & CA, AB, CB & CB, BA, CA Now if you remove BC too you will have only 2 transitive triples (Fig.4.), but if you remove CB instead, you are down to 1 transitive triple (Fig.5.), and if you remove CA instead, you NO transitive triple is (Fig.6.).
Transitivity In this network of 4 there is no reciprocal relationship. But it has one transitive triple ABC: AB, BC, AC. E.g.: BCA is intransitive: BC, CA, BA. So is BAC : BA, AC, BC etc. What should we do with ACD? AC, CD, A ? D ACD is not intransitive, it is called “vacuously transitive.” A triple that has fewer than three ties is called “vacuously transitive.” Therefore transitive triples are also referred to as “non-vacuously transitive.” Reported as: • Proportion of transitive triples among all possible triples: • All possible (ordered) triples from 3 nodes is 6. 4 nodes can form 4 triads (leaving out a different one each time.) All possible triples from 4 nodes is 6*4=24. We find only 1 (non-vacuously) transitive triple: ABC • 1/24=.042 • Proportion of transitive triples among triads where one single link could complete a triad. • We have three such triples: ABC, ACD, BCD but the last two triples have only two ties, so they are vacuously transitive. • 1/3=.333 • # transitive triples/(# transitive triples + # vacuously transitive triples that could be [non-vacuously] transitive ) In UCINET: Network Cohesion Transitivity Choose Adjecency for the Type of transitivity
Clustering Clustering – measures a tendency towards dense local neighborhoods neighborhood: other nodes to which ego is connected. size of the neighborhood: the number of potential connection among the nodes in the neighborhood. Node’s clustering coefficient: • density of ties between nodes directly adjacent to it, excluding the ties to the node itself. • A has two neighbors B and C. They make one pair (BC), and have one tie between them. The density of the network consisting of B and C is 1/1=1. • B – the same for B • C has three potential pairs in its neighbors: AB,AD, BD. Density of the network consisting of these nodes is 1/3=.333 • For the coefficient to be calculated, a node has to have at least two ties • D has only one ties, no clustering coefficient can be calculated Note: when UCINET calculates ties, 1 tie is a symmetric or a reciprocal tie. An asymmetric directed tie counts as half a tie. Here all ties are symmetric. • Average node (overall graph) clustering:(1+1+.333)/3=.778 • Average node clustering weighted by the size of node’s neighborhood: (1*1+1*1+.333*3)/(1+1+3)=.600 In UCINET: Network Cohesion Clustering coefficient
Correlation between Two Networks with the Same Actors Friendship Network Invitation to a Birthday Party Network Bivariate Statistics 1 2 3 4 5 6 7 Value Signif Avg SD P(Large) P(Small) NPerm --------- --------- --------- --------- --------- --------- --------- 1 Pearson Correlation: 0.331 0.194 0.004 0.244 0.194 0.964 2500.000 2 Simple Matching: 0.667 0.194 0.513 0.115 0.194 0.964 2500.000 3 Jaccard Coefficient: 0.412 0.194 0.254 0.115 0.194 0.964 2500.000 4 Goodman-Kruskal Gamma: 0.625 0.194 -0.001 0.460 0.194 0.964 2500.000 5 Hamming Distance: 10.000 0.194 14.598 3.447 0.964 0.194 2500.000 In UCINET: Tools Testing Hypotheses Dyadic (QAP) QAP Correlation (old)
Measures of Correlation between Two Networks with the Same Actors • The units of analysis or cases here are the dyads. With N actors you have M=N*(N-1) cases. • The data file used here is of the familiar cases by variables format • Which correlation measure to use depends on how the tie is measured. • Binary ties (the two variables are dichotomous): • If the information content of 0 is less than the information content of 1. E.g., if we both mention X as our best friend that reveals our similarity. But if neither of us mentions X as our best friend that does not necessarily mean we are similar. • Jaccard coefficient • J=M11/(M01+M10+M00) M11=# of dyads where both ties are 1, M01=# of dyads where 1st tie is 0, 2nd tie is 1 etc. • If the information content of 0 is the same as the information content of 1. E.g., if we are forced to sort people into friend or enemy and we both choose X as friend, that is as informative as both of us choosing X as our enemy. • Simple Matching • S=(M11+M00)/(M00+M01+M10+M11) • Hamming Distance=(1-S)*M or the number of mismatched dyads • Ordinal ties (the two variables are ordinal, e.g.: Do you talk often, rarely, never?) • Goodman-Kruskall gamma • Interval/Ratio ties (the two variables are interval/ratio, e.g.: How many times did you talk last week?) • Pearson’s correlation
Network Positions and Social Roles Similarity or equivalence of actors’ positions can be defined in several ways: • Structural equivalence – two nodes have the same relations with the same set of other nodes • Actors A and B – each is tied to nodes C,D,E,F,G • Actors C,D,E,F,G– each is tied to both A and B • Automorphic equivalence identifies actors in the same configuration of ties. They do not have to have ties to the same set. But they have the same centrality, ego density and clique size. • Actors A, B – A is tied to C,G,D and B is tied to E,F,D and C,G are like F,E • Actors C, G, F, E • Actors C and G are not just automorphically but also structurally equivalent and so are F and E. • Regular equivalence – two nodes have the same profile of ties with members of other sets of actors. It describes social roles, e.g. mother in a family. • Actors A, B -- e.g. mothers • Actors C, G, D, F, E – e.g. children • Actors C and G are also automorphically and structurally equivalent, so are D,F,E
Network Positions and Social Roles In the figure you find: • Structural equivalence • Actors E and F • Actors H and I • Automorphic equivalence • Actors B, D • Actors E, F, H, I • Regular equivalence • Actors B, C, D • Actors E, F, G, H, I • Actors that are structurally equivalent • are also automorphically and regularly equivalent. • Actors that are automorphically equivalent • are also regularly equivalent In UCINET: Network Roles & Positions Structural Profile for stuctural equivalence (for full s.e. you look for a coefficient of 0.00)Network Roles & Positions Automorphic All Permutations for automorphic equivalence Network Roles & Positions Maximal Regular Optimization for regular equivalence
Network Subgroups: Cliques Clique - a sub-set of a network in which the actors are more closely and intensely tied to one another than they are to other members of the network. It is a cohesive subgroup connected with many direct and reciprocated ties. • Formally, a clique is the maximum number of actors but at least three, who have all possible ties present among themselves • Within a clique the geodesic distance is 1 for everyone (everyone is directly related) • In terms of friendship ties, for example, it is not unusual for people in human groups to form "cliques" on the basis of age, gender, race, ethnicity, religion/ideology, and many other things • Cliques tend to indicate stronger relationships, similarity in information and resources available, more constraint, but also more support • The above definition of the clique is very strict, so there are many other types of sub-groups you can identify in a network (N-cliques, N-clans, K-plexes, K-cores, F-groups) with less restrictive assumptions about in-group and out-group ties
Cliques 1 cliques found. 1: Ana Jen Liz Pat Actor-by-Actor Clique Co-Membership Matrix 1 2 3 4 5 6 A J L P N M - - - - - - 1 Ana 1 1 1 1 0 0 2 Jen 1 1 1 1 0 0 3 Liz 1 1 1 1 0 0 4 Pat 1 1 1 1 0 0 5 Nancy 0 0 0 0 0 0 6 Mona 0 0 0 0 0 0 HIERARCHICAL CLUSTERING OF EQUIVALENCE MATRIX N a M A J L P n o n e i a c n a n z t y a Level 1 2 3 4 5 6 ----- - - - - - - 1.000 XXXXXXX . . 0.000 XXXXXXXXXXX In UCINET: Network Subgroups Cliques
Correspondence Analysis for Two-Mode Networks • In UCINET: Tools Scaling/Decomposition Correspondence …
Correspondence Analysis for Two-Mode Networks • SINGULAR VALUES • FACTOR VALUE PERCENT CUM % RATIO PRE CUM PRE • ------- ------ ------- ------- ------- ------- ------- • 1: 0.848 47.9 47.9 1.495 0.616 0.616 • 2: 0.567 32.0 79.9 1.597 0.275 0.892 • 3: 0.355 20.1 100.0 0.108 1.000 • ======= ====== ======= ======= ======= • 1.770 100.0 • Row Scores • 1 2 3 • ------ ------ ------ • 1 Ana 0.678 0.596 0.273 • 2 Jen 0.545 -0.032 -0.672 • 3 Pat 0.240 -0.941 0.239 • 4 Liz 0.240 -0.941 0.239 • 5 Nancy -0.841 -0.196 0.072 • 6 Mona -1.921 0.549 -0.096 • Column Scores • 1 2 3 • ------ ------ ------ • 1 BDP1 0.203 -0.534 0.085 • 2 BDP2 0.721 0.497 -0.562 • 3 BDP3 0.799 1.051 0.768 • 4 BDP4 -1.628 0.312 -0.034 • There are four birthday parties, therefore we can display every girl in a four dimensional space. • Correspondence analysis (CA) tries to find a simpler space with fewer dimensions, that still describes the relative positions of the six girls fairly accurately. • It is always possible to derive K-1 dimensions (or factors) from K dimensions, if you are willing to take the sum of the four dimensions as given. The last dimension then can be obtained from the sum by subtraction. • CA derived 3 factors from the 4 birthday parties. • The first factor explains 47.9% of the connections among the 6 girls. • The second explains 32%, the third 20.1%. • The factors are always ordered from the highest to the lowest explanatory power. The hope is that one can derive a few (say, two) factors that explainsa large percent of the connections. • The plot takes the first two dimensions and places each girl and birthday party according to their scores on those two factors. E.g. Ana’s position on the 1st factor is 0.678 and on the 2nd 0.596. Pat and Liz have identical values (0.240, -0.941) and they are occupying the exact same spot. • The question is: what do these factors mean? What explains the pattern of association? • If we know something about the parties we can speculate. • E.g. Suppose Factor 1 is the size of the party, Factor 2 is the amount of dancing at the party. • Then BDP3 was the largest, BDP2 was almost as large, and BDP4 was the smallest. BDP3 was the danciest and BDP1 was the least dancy. Ana is invited to larger and dancier parties, Mona to small and dancy parties etc.This may tell you something about the relationships among the girls.