Download
1 / 69
690 likes | 852 Vues
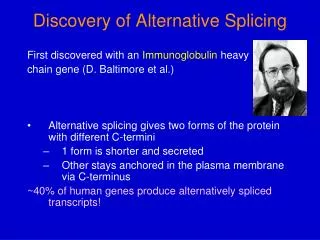
Alternative Splicing from ESTs. Eduardo Eyras Bioinformatics UPF – February 2004. Intro ESTs Prediction of Alternative Splicing from ESTs. Transcription. exons. introns. pre-mRNA. Splicing. Mature mRNA. Translation. Peptide. 5’. 3’. 3’. 5’. 5’ CAP. AAAAAAA. Different Splicing.

E N D
Alternative Splicing from ESTs Eduardo Eyras Bioinformatics UPF – February 2004
Intro • ESTs • Prediction of • Alternative Splicing from ESTs
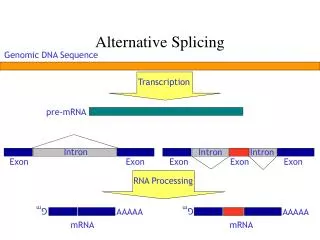
Transcription exons introns pre-mRNA Splicing Mature mRNA Translation Peptide 5’ 3’ 3’ 5’ 5’ CAP AAAAAAA
Different Splicing Mature mRNA Translation Different Peptide 5’ 3’ 3’ 5’ Transcription exons introns pre-mRNA 5’ CAP AAAAAAA
Alt splicing as a mechanism of gene regulation Functional domains can be added/subtracted protein diversity Can introduce early stop codons, resulting in truncated proteins or unstable mRNAs It can modify the activity of the transcription factors, affecting the expression of genes It is observed nearly in all metazoans Estimated to occur in 30%-40% of human
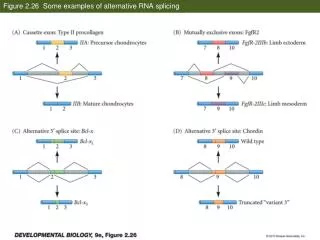
Forms of alternative splicing Exon skipping / inclusion Alternative 3’ splice site Alternative 5’ splice site Mutually exclusive exons Intron retention Constitutive exon Alternatively spliced exons
ESTs (Expressed Sequence Tags) Single-pass sequencing of a small (end) piece of cDNA Typically 200-500 nucleotides long It may contain coding and/or non-coding region
5’ 5’ 5’ 3’ 3’ 3’ AAAAAA AAAAAA AAAAAA ESTs Cells from a specific organ, tissue or developmental stage mRNA extraction Add oligo-dT primer TTTTTT 3’ 5’ Reverse transcriptase RNA TTTTTT DNA 3’ 5’ Ribonuclease H TTTTTT 3’ 5’ DNA polimerase Ribonuclease H 5’ 3’ AAAAAA Double stranded cDNA TTTTTT 3’ 5’
ESTs 5’ 3’ AAAAAA Clone cDNA into a vector TTTTTT 3’ 5’ 5’ EST Single-pass sequence reads Multiple cDNA clones 3’ EST
Alternative Splicing from ESTs Genomic Primary transcript Splicing Splice variants cDNA clones EST sequences 5’ 3’ 5’ 3’
Alternative Splicing from ESTs ESTs can also provide information about potential alternative splicing when aligned to the genome (and when aligned to mRNA data)
EST sequencing • Is fast and cheap • Gives direct information about the gene sequence • Partial information Resulting ESTs Known gene (DB searches) Similar to known gene Contaminant Novel gene
Anatomical System The tissue, organ or anatomical system from which the sample was prepared. Examples are digestive, lung and retina. Cell Type The precise cell type from which a sample was prepared. Examples are: B-lymphocyte, fibroblast and oocyte. Pathology The pathological state of the sample from which the sample was prepared.Examples are: normal, lymphoma, and congenital. Developmental Stage The stage during the organism's development at which the sample was prepared. Examples are: embryo, fetus, and adult. Pooling Indicates whether the tissue used to prepare the library was derived from single or multiple samples. Examples are pooled, pooled donor and pooled tissue. ESTs provide expression data eVOC Ontologieshttp://www.sanbi.ac.za/evoc/
Linking the expression vocabulary to gene annotations ESTs Genes
The down side of the ESTs • Cannot detect lowly/rarely expressed genes or non-expressed sequences (regulatory) Random sampling: the more ESTs we sequence the less new useful sequences we will get
Gene Hunting • Sequencing of the Human Genome (HGP) EST Sequencing
Origin of the ESTs • Science. 1991 Jun 21;252(5013):1651-6 • Complementary DNA sequencing: expressedsequence tags and human genome project. • Adams MD, Kelley JM, Gocayne JD, Dubnick M, Polymeropoulos MH, Xiao H, Merril CR,Wu A, Olde B, Moreno RF, et al.Section of Receptor Biochemistry and Molecular Biology, National Institute of Neurological Disorders and Stroke, National Institutes of Health, Bethesda, MD. Automated partial DNA sequencing was conducted on more than 600 randomly selected human brain complementary DNA (cDNA) clones to generate expressed sequence tags (ESTs). ESTs have applications in the discovery of new human genes, mapping of the human genome, and identification of coding regions in genomic sequences. Of the sequences generated, 337 represent new genes, including 48 with significant similarity to genes from other organisms, such as a yeast RNA polymerase II subunit; Drosophila kinesin, Notch, and Enhancer of split; and a murine tyrosine kinase receptor. Forty-six ESTs were mapped to chromosomes after amplification by the polymerase chain reaction. This fast approach to cDNA characterization will facilitate the tagging of most human genes in a few years at a fraction of the cost of complete genomic sequencing, provide new genetic markers, and serve as a resource in diverse biological research fields.
EST-sequencing explosion non-exclusivity (1992) • Merck and WashU (1994) • public ESTs • GenBank • dbEST
dbEST release 20 February 2004 • Number of public entries: 20,039,613 • Summary by organism • Homo sapiens (human) 5,472,005 • Mus musculus + domesticus (mouse) 4,056,481 • Rattus sp. (rat) 583,841 • Triticum aestivum (wheat) 549,926 • Ciona intestinalis 492,511 • Gallus gallus (chicken) 460,385 • Danio rerio (zebrafish) 450,652 • Zea mays (maize) 391,417 • Xenopus laevis (African clawed frog) 359,901 • …
EST lengths ~ 450 bp Human EST length distribution (dbEST Sep. 2003 )
What is an EST cluster? A cluster is a set of fragmented EST data (plus mRNA data if known), consolidated according to sequence similarity Clusters are indexed by gene such that all expressed data concerning a single gene is in a single index class, and each index class contains the information for only one gene. (Burke, Davison, Hide, Genome Research 1999).
EST pre-processing Vector Repeats Mitochondrial Xenocontaminants
EST Clustering • UniGene (NCBI) www.ncbi.nlm.nih.gov/UniGene • TIGR Human Gene Index www.tigr.org • (The Institute for Genomic Research) • StackDB www.sanbi.ac.za • (South African Bioinformatics Institute)
UniGene • Species UniGene Entries • Homo sapiens 118,517 • Mus musculus 82,482 • Rattus norvegicus 43,942 • Sus scrofa 20,426 • Gallus gallus 11,970 • Xenopus laevis 21,734 • Xenopus tropicalis 17,102 • …
ESTs aligned to the genome • Some advantages: • It defines the location of exons and introns • We can verify the splice sites of introns (e.g. GT-AG) • hence also check the correct strand of spliced ESTs • It helps preventing chimeras • It can avoid putting together ESTs from paralogous genes • We can prevent including pseudogenes in our analysis
Aligning ESTs to the Genome • Many ESTs Fast programs, Fast computers • Nearly exact matches Coverage >= 97% • Percent_id >= 97% • Splice sites: GT—AG, AT—AC, GC—AG
Aligning ESTs to the Genome Extra pre-processing of ESTs: • Clip poly A tails/Clip 20bp from either end • Best in genome • Remove potential processed pseudogenes • Give preference to ESTs that are spliced
Human ESTGenes Genomic length distribution of aligned human ESTs ~ 400bp Tail up to ~ 800kb
The Problem ESTs Genome What are the transcripts represented in this set of mapped ESTs?
Predict Transcripts from ESTs ESTs Transcript predictions Merge ESTs according to splicing structure compatibility
Representation Every 2 ESTs in a Genomic Cluster may represent the same splicing (redundant) or not The redundancy relation is a graph: x x Extension y y x Inclusion x z z Sort by the smallest coordinate ascending and by the largest coordinate descending
Criteria of merging Allow edge-exon mismatches Allow internal mismatches Allow intron mismatches
Transitivity x x y y Extension z w x Inclusion z x z w w This reduces the number of comparisons needed
ClusterMerge graph Each node defines an inclusion sub-tree y z y x z x Extensions form acyclic graphs x x y y z z w w
Recovering the Solution Mergeable sets of ESTs can be recovered as special paths in the graph 1 4 2 3 5 6 7 8 9
Recovering the Solution Root: does not extend any node Root 1 4 2 3 5 6 7 Leaves 8 9 Leaf: not-extended and root of an inclusion tree
Recovering the Solution Any set of ESTs in a path from a root to a leaf is mergeable Root 1 4 2 3 5 6 7 Leaves 8 9
Recovering the Solution Add the inclusion tree attached to each node in the path Root 1 4 2 3 5 6 7 Leaves 8 9
Recovering the Solution Lists produced: (1,2,3,4,5,6,7,8) ( 1,2,3,4,5,6,7,9) 1 4 2 3 5 6 7 8 9 This representation minimizes the necessary comparisons between ESTs
How to build the graph Mutual Recursion Inclusion => go up in the tree Recursion search along extension branch Search graph (leaves) Search sub-graph
How to build the graph Example 1 2 3 4 5 6
How to build the graph Example 1 3 1 2 3 2 5 4 5 6 4 6
How to build the graph Example 1 3 1 2 3 2 5 4 5 6 4 6 7 Leaves
How to build the graph Example 1 3 1 2 3 2 5 4 5 6 4 6 7 Inclusion
How to build the graph Example 1 3 1 2 3 2 5 4 5 6 4 6 7 Inclusion
How to build the graph Example 1 3 1 2 3 2 5 4 5 6 4 6 7 Extension