Download
1 / 13
130 likes | 237 Vues
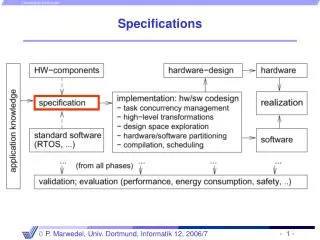
GTK: list of specifications. Things could be seen in a different way according to the points of view. This is a list from the perspective of an end-user rather than a chip designer. Some considerations on: What and how to measure them in an electrical test. List of specifications.

E N D
GTK: list of specifications Things could be seen in a different way according to the points of view This is a list from the perspective of an end-user rather than a chip designer Some considerations on: What and how to measure them in an electrical test Flavio Marchetto INFN - Torino
List of specifications • Time resolution • Target: 200 psec (r.m.s.) on the single hit • We have three components: • sJ due to the jitter: noise induced by the environment • sT due to the time-walk: corrected hardware-wise in the On-pixel-TDC and offline in the End-of-Column TDC. • sD due to the digitization: bin size and TDC deviation from linearity
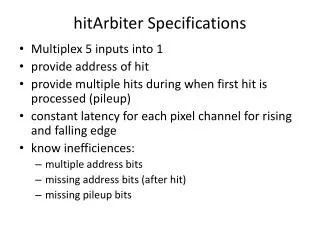
2. Dead time Target of the dead time : < 1% Defined by the minimum time interval to detect two hitsin the same pixeltimesthe hit per pixel frequency: DT = DT x f Being the expected maximum frequency of hits on a pixel equal to 150 kHz then the minimum time interval should be smaller than 65 nsec. DT depends on two components: a) DTA:Analog part: capability of the preampli+discri to resolve two close hits b) DTD: Digitization part The way these two components combine depends on the architecture.
3. Detection efficiency Target of the hit detection efficiency: > 99% The average charge in a Si-layer of 200 mm is 2.5 fC ( ~15000 electrons) The efficiency is defined by the preampli gain and the threshold level set on the discriminator : For particles contained in a single pixel, an input threshold set to 1 fC or 6000 electrons is a safe value for fully efficiency request. For particles which are sharing the deposited charge between several pixels then one has to decrease the threshold (under study).
fC electrons
Noise The noise is more related to the sensor. As a function of the threshold one has to measure the rate with no beam Radiation tolerance • Radiation can effect the performance in two ways: • SEU (Single Event Upset) • Integral dose deterioration Charged particles Neutrons
How to measure the above specifications ? • Electrical test: nake chip mounted on a PCB • Laser test: chip bump-bonded to a sensor • Beam test at the ps or SPS or outside CERN: chip bump-bonded to a sensor • Radiation tolerance test
Electrical tests • Time resolution • Inject a fixed charge through the input capacitance and measure the discriminator output jitter to evaluate sJ • Inject a variable charge (1. – 5 fC) through the input capacitance and measure the discriminator output time spread to evaluate: • Measurement of the complete time resolution using the digitized fine time requires an injection signal in constant phase with the clock signal. • Varying the phase of the charge injection with respect to the clock one can measure the linearity of the TDC response. • A random timing of the charge injection pulse can be used to study the behaviour of the TDC fine-time: it is expected a flat distribution of the fine-time
Hit detection efficiency By varying the injection signal one can determine the efficiency as a function of the threshold. Question : is there a way to measure quantitatively the efficiency ?
Beam test • The detectors are bump-bonded to the chip • We have a box on which we can mount up to 4 PCB’s with sensor bonded to the chip • The box can be cooled to < 5 C. • The overall dimensions of the PCB are independent on the ASIC type (CERN or To), thus one can mount a mixture of chips • The beam is a ‘low intensity’ beam with the smallest possible transverse dimensions (~ 5x5 mm2) • Particle momentum is such that can be considered minimum ionizing particles: PS or SPS are both suitable. The Cyclotron at Louvain ( proton at 80 MeV) could be used but the signals would be larger than in the experiment with an average charge of ~17 fC instead of 2.5 fC.
At the signal distributed by the accelerator beam extraction at the PS or SPS the “Front-End” logic aligns the time counters. In the case of the Cyclotron the same operation is done every few seconds. Measurement of the time resolution • Method “triggerless” • Two detectors (A and B) of the same design option -> expected same time resolution • Select tracks with hits in pixel i in detector A and j in detector B B A j i
The time offset between the two times is constant • The average of the distribution of the time difference is the time offset and the width is related to the time resolution s (ti – tj) toffset ti - tj
Method with an “independent detector” • An independent detector measures the track time with a resolution of 100 psec of better • The time of the detector has to be kept in phase with the chip time