Download
1 / 11
110 likes | 211 Vues
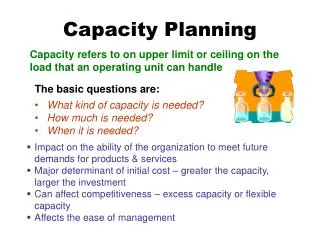
CAPACITY INVESTMENT PLANNING MODEL. CHE 5480- Spring 2003 University of Oklahoma School of Chemical Engineering and Materials Science Prof. M. Bagajewicz. Set of Processes Set of Chemicals. Process Network. GIVEN:. B. 2. C. 1. A. Demands & Availabilities Costs & Prices

E N D
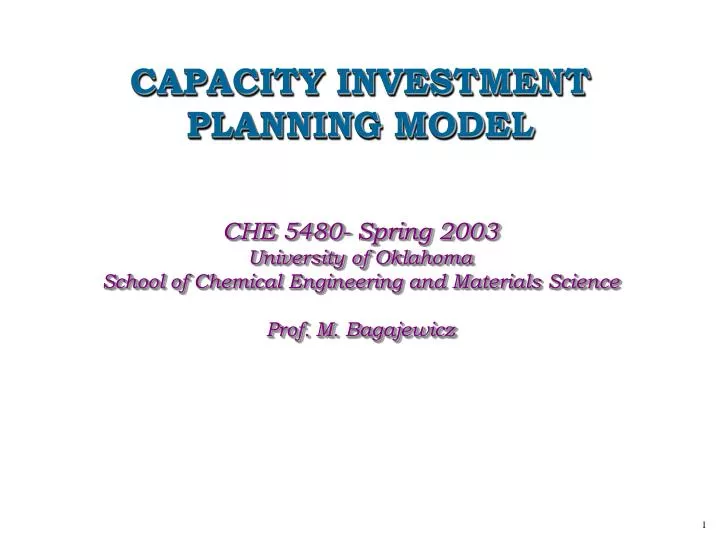
CAPACITY INVESTMENT PLANNING MODEL CHE 5480- Spring 2003 University of Oklahoma School of Chemical Engineering and Materials Science Prof. M. Bagajewicz
Set of Processes Set of Chemicals Process Network GIVEN: B 2 C 1 A Demands & Availabilities Costs & Prices Capital Budget 3 D Forecasted Data Timing Sizing Location DETERMINE: Network Expansions Production Levels OBJECTIVES: Maximize Net Present Value Process Planning Under Uncertainty
Design Variables: to be decided before the uncertainty reveals Y: Decision of building process i in period t E: Capacity expansion of process i in period t Q: Total capacity of process i in period t { } x = Y E Q , , it it it W S P it jlt jlt Capacity Investment Planning Control Variables:selected after uncertain parameters become known. Assume them known for the time being!!!! { } ys = , , S: Sales of product j in market l at time t and scenario s P: Purchase of raw mat. j in market l at time t and scenario s W: Operating level of of process i in period t and scenario s
Chemical 5 Process 1 Process 2 Process 3 Process 5 Process 4 Chemical 6 Chemical 1 Chemical 2 Chemical 7 Chemical 8 Chemical 4 Chemical 3 Example Project Staged in 3 Time Periods of 2, 2.5, 3.5 years
Chemical 5 5.27 kton/yr Process 1 Chemical 1 5.27 kton/yr 10.23 kton/yr Chemical 7 19.60 kton/yr Process 3 22.73 kton/yr Chemical 3 19.60 kton/yr Solution Period 1 2 years
Chemical 5 4.71 kton/yr Chemical 1 4.71 kton/yr 10.23 kton/yr 20.87 kton/yr Chemical 7 Chemical 8 20.87 kton/yr 22.73 kton/yr 22.73 kton/yr Chemical 3 41.75 kton/yr Chemical 4 22.73 kton/yr 20.87 kton/yr Process 1 Process 3 Process 5 Process 4 Solution Period 2 2.5 years
14.95 kton/yr Chemical 5 29.49 kton/yr Chemical 6 Chemical 1 29.49 kton/yr 44.44 kton/yr 80.77 kton/yr 80.77 kton/yr Chemical 2 29.49 kton/yr 21.88 kton/yr Chemical 7 Chemical 8 Process 2 21.88 kton/yr Process 1 22.73 kton/yr 22.73 ton/yr Chemical 3 43.77 kton/yr Chemical 4 Process 5 Process 3 22.73 kton/yr 21.88 kton/yr Process 4 Solution Period 3 3.5 years
MODEL I : Processes i,=1,…,NP J : Raw materials and Products, j=1,…,NC T: Time periods. T=1,…,NT L: Markets, l=1,..NM SETS Yit: An expansion of process I in period t takes place (Yit=1), does not take place (Yit=0) Eit: Expansion of capacity of process i in period t. Qit: Capacity of process i in period t. Wit: Utilized capacity of process i in period t. Pjlt : Amount of raw material/intermediate product j consumed from market l in period t Sjlt : Amount of intermediate product/product j sold in market l in period t VARIABLES ηij : Amount of raw material/intermediate product j used by process i μij : Amount of product/intermediate product j consumed by process i γjlt : Sale price of product/intermediate product j in market l in period t Γjlt : Cost of product/intermediate product j in market l in period t δit : Operating cost of process i in period t αit : Variable cost of expansion for process i in period t βit : Fixed cost of expansion for process i in period t Lt : Discount factor for period t PARAMETERS Lower and upper bounds on a process expansion in period t Lower and upper bounds on availability of raw material j in market l in period t Lower and upper bounds on demand of product j in market l in period t Maximum capital available in period t NEXPt: maximum number of expansions in period t
MODEL OBJECTIVE FUNCTION INVESTMENT DISCOUNTED REVENUES Yit: An expansion of process I in period t takes place (Yit=1), does not take place (Yit=0) Eit: Expansion of capacity of process i in period t. Wit: Utilized capacity of process i in period t. Pjlt : Amount of raw material/interm. product j consumed from market l in period t Sjlt : Amount of intermediate product/product j sold in market l in period t γjlt : Sale price of product/intermediate product j in market l in period t Γjlt : Cost of product/intermediate product j in market l in period t δit : Operating cost of process i in period t αit : Variable cost of expansion for process i in period t βit : Fixed cost of expansion for process i in period t Lt : Discount factor for period t I : Processes i,=1,…,NP J : Raw mat./Products, j=1,…,NC T: Time periods. T=1,…,NT L: Markets, l=1,..NM
MODEL LIMITS ON EXPANSION TOTAL CAPACITY IN EACH PERIOD LIMIT ON THE NUMBER OF EXPANSIONS LIMIT ON THE CAPITAL INVESTMENT Yit: An expansion of process I in period t takes place (Yit=1), does not take place (Yit=0) Eit: Expansion of capacity of process i in period t. Qit: Capacity of process i in period t. NEXPt: maximum number of expansions in period t αit : Variable cost of expansion for process i in period t βit : Fixed cost of expansion for process i in period t Lower and upper bounds on a process expansion in period t I : Processes i,=1,…,NP J : Raw mat./Products, j=1,…,NC T: Time periods. T=1,…,NT L: Markets, l=1,..NM
MODEL UTILIZED CAPACITY IS LOWER THAN TOTAL CAPACITY MATERIAL BALANCE BOUNDS INTEGER VARIABLES NONNEGATIVITY Yit: An expansion of process I in period t takes place (Yit=1), does not take place (Yit=0) Eit: Expansion of capacity of process i in period t. Qit: Capacity of process i in period t. Wit: Utilized capacity of process i in period t. Pjlt : Amount of raw material/intermediate product j consumed from market l in period t Sjlt : Amount of intermediate product/product j sold in market l in period t I : Processes i,=1,…,NP J : Raw mat./Products, j=1,…,NC T: Time periods. T=1,…,NT L: Markets, l=1,..NM Lower and upper bounds on availability of raw material j in market l in period t Lower and upper bounds on demand of product j in market l in period t