Download
1 / 38
390 likes | 397 Vues
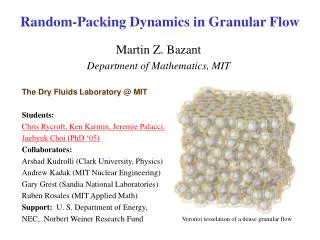
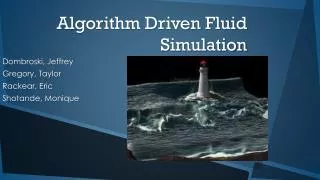
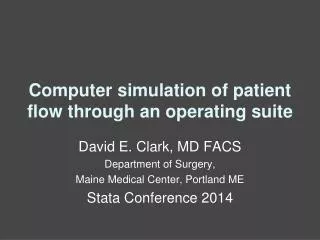
Computer Simulation of Gravity-Driven Granular Flow. Western Canadian Conference for Young Researchers in Mathematics. University of Western Ontario Department of Applied Mathematics John Drozd and Dr. Colin Denniston. Granular Matter. Granular matter definition

E N D
Computer Simulation of Gravity-Driven Granular Flow Western Canadian Conference for Young Researchers in Mathematics University of Western Ontario Department of Applied Mathematics John Drozd and Dr. Colin Denniston
Granular Matter • Granular matter definition • Small discrete particles vs. continuum • Granular matter interest • Biology, engineering, geology, material science, physics. • Mathematics and computer science. • Granular motion • Energy input and dissipation. • Granular experiments • Vibration
Small Amplitude Surface Waves Large Amplitude Surface Waves 3-Node Arching C. Wassgren et al. 1996
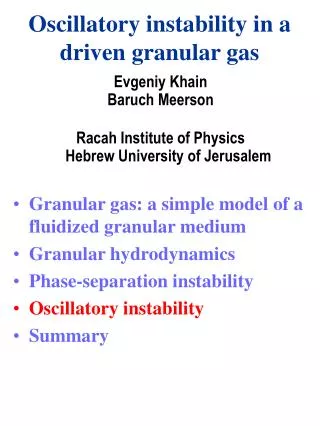
Other Phenomena in Granular Materials • Shear flow • Vertical shaking • Horizontal shaking • Conical hopper • Rotating drum • Cylindrical pan
Cylindrical Pan Oscillations Oleh Baran et al. 2001
Vibratory Drum Grinder Raw Feed Grinding Media, Rods Reactor Springs Vibrator Motor Ground Product Isolation Spring Vibratory Drum Grinder
Goal • Find optimum oscillation that results in a force between the rods which achieves the ultimate stress of a particular medium that is to be crushed between the rods. • Minimize the total energy required to grind the medium. • Mixing is also important.
Harry Swinney et al. 1997
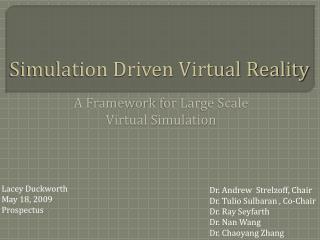
Granular Materials: A window to studying the Transition from a non-Newtonian Granular Fluid To A "Glassy" system
Savage and Jeffrey J. Fluid Mech. 130, 187, 1983. Velocity q Collision rules for dry granular media as modelled by inelastic hard spheres As collisions become weaker (relative velocity vn small), they become more elastic. C. Bizon et. al., PRL 80, 57, 1997.
300 (free fall region) Donev et alPRL96 "Do Binary Hard Disks Exhibit an Ideal Glass Transition?" polydisperse monodisperse 250 (fluid region) vy 200 (glass region) dvy/dt 150 P y Polydispersity means Normal distribution of particle radii x z y Donev et al PRE 71
The density in the glassy region is a constant. In the interface between the fluid and the glass does the density approach the glass density exponentially? 0 = 0.9 0 = 0.95 0 = 0.99 Interface width seems to increase as 0 1 vy y How does depend on (1 0) ?
Length Scale in Transition Slope = 0.42 poly Slope = 0.46 mono "interface width diverges"
Y Velocity Distribution 300 (free fall region) Poiseuille flow 250 (fluid region) Plug flow snapshot 200 (glass region) Mono-disperse (crystallized) only Mono kink fracture 150 y z x
300 (free fall region) Granular Temperature fluid 250 (fluid region) 235 (At Equilibrium Temperature) 200 (glass region) equilibrium 150 y glass x z
Fluctuating and Flow Velocity Experiment by N. Menon and D. J. Durian, Science, 275, 1997. 16 x 16 32 x 32 v Simulation results In Glassy Region ! J.J. Drozd and C. Denniston vf Europhysics Letters, 76 (3), 360, 2006 "questionable" averaging over nonuniform regions gives 2/3
1 in fluid glass transition For 0 = 0.9,0.95,0.96,0.97,0.98,0.99 Subtracting of Tg and vc and not averaging over regions of different vx2 Down centre Slope = 1.0
"Particle Dynamics in Sheared Granular Matter" Physical Review Letters 85, Number 7, p. 1428 (2000) Experiment: (W. Losert, L. Bocquet, T.C. Lubensky and J.P. Gollub)
Velocity Fluctuations vs. Shear Rate U Slope = 0.406 0.018 Experiment Slope = 0.4 From simulation Must Subtract Tg ! Physical Review Letters 85, Number 7, (2000)
q Shear Stress y x
Viscosity vs Temperature Slope ~ 2 1 1.92 0.084 Transformation from a liquid to a glass takes place in a continuous manner. Relaxation times of a liquid and its Shear Viscosity increase …can do slightly better… very rapidly as Temperature is lowered. …"anomalous" viscosity. Is a fluid with "infinite" viscosity a useful description of the interior phase?
Experimental data from the book: “Sands, Powders, and Grains: An Introduction to the Physics of Granular Materials” By Jacques Duran.
Related to Forces: Impulse Distribution Most frequent collisions contributing to smallest impulses Simulation Impulse defined: Magnitude of momentum after collision minus momentum beforecollision. Experiment (Longhi, Easwar) Quasi-1d Theory (Coppersmith, et al)
Power Laws for Collision Times Collision time = time between collisions 1) spheres in 2d 2) 2d disks 3) 3d spheres Similar power laws for 2d and 3d simulations!
Comparison With Experiment : experiment 1.5 vs. simulation 2.8 Discrepancy as a result of Experimental response time and sensitivity of detector. Experiment “Spheres in 2d”: 3d Simulation with front and back reflecting walls separated one diameter apart Pressure Transducer Figure from experimental paper: “Large Force Fluctuations in a Flowing Granular Medium” Phys. Rev. Lett. 89, 045501 (2002) E. Longhi, N. Easwar, N. Menon
Probability Distribution for Impulses vs. Collision Times (log scale) = 2.75 = 1.50
random packing at early stage = 2.75 Is there any difference between this glass and a crystal? Answer: Look at Monodisperse grains crystallization at later stage = 4.3 Disorder has a universal effect on Collision Time power law.
Conclusions • A gravity-driven hard sphere simulation was used to study the glass transition from a granular hard sphere fluid to a jammed glass. • We get the same 2/3 power law for velocity fluctuations vs. flow velocity as found in experiment, when each data point is averaged over a nonuniform region. • When we look at data points averaged from a uniform region we find a power law of 1 as expected. • We found a diverging length scale at this jamming (glass) to unjamming (granular fluid) transition. • We compared our simulation to experiment on the connection between local velocity fluctuations and shear rate and found quantitative agreement. • We resolved a discrepancy with experiment on the collision time power law which we found depends on the level of disorder (glass) or order (crystal).
Momentum Conservationkik+gi = 0 Normal Stresses Along Height Weight not supported by a pressure gradient.