Download
1 / 27
270 likes | 403 Vues
Measures of Academic Progress. An Orientation for Parents Tara Gray Spiritridge Principal Intern and Instructional Technology Curriculum Leader. Purpose for this evening’s session:. Learn about MAP What it is Who made it Why we use it (formative vs. summative MSP)

E N D
Measures of Academic Progress An Orientation for Parents Tara Gray Spiritridge Principal Intern and Instructional Technology Curriculum Leader
Purpose for this evening’s session: Learn about MAP • What it is • Who made it • Why we use it (formative vs. summative MSP) • What it looks like • How we use it • How we are doing
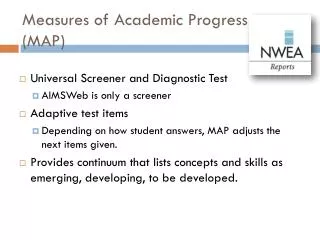
What is MAP? • Measures of Academic Progress • Multiple choice, adaptive computer based tests • reading and math (fall and spring) • Aligned to State Standards • Universal assessment - continuous measures for grades Kindergarten – 9th grade
Who makes MAP? NWEA – Northwest Evaluation Association • Nonprofit organization • Used by districts nationally • Support the implementation of the Common Core State Standards • 24 million assessments since starting in 1977 • More information at www.nwea.org
Why this test? • Formative • Adaptive • Universal • Computer based • Eliminates scoring bias • Shifts teacher time from scoring to interpreting
Summative vs. FormativeAssessment OF vs. FOR • Assessments OF learning determine how much has been learned at a particular point in time (status). • Assessments FOR learning provide feedback that is used to modify teaching and learning activities during instruction.
MSP Test assessments OF learning: • The MSP or Measure of Student Progress (WA State Test) • one test fits all • timed • report status after instruction has occurred
What does the MSP look like? MSP Sample from the 3rd grade reading test (retired questions)
MAP are assessments FORlearning • customized to the individual student • compare students to self and others • untimed • inform instruction • address the skills that underpin the standards • focus on growth • Like a medical “check-up”
What does MAP look like? MAP Samples from the 3rd - 5th grade reading test (retired questions)
Make sure your name is shown on the screen. The first screen you see will look like this. Wait for directions and then click on the “Start Test” button.
Sample Reading Question • Read the passage and select the best answer • Click the <Go on> button
Sample Reading Question • Some reading items have scroll bars. • As you read, move the scroll bar down by using your mouse.
MAP Assessments • Reading • Grades 3-5 • Math • Grades K-5
Reading MAP for 3-8 Measures: • Word Analysis and Vocabulary • Literal Comprehension • Interpretive Comprehension • Literary Response and Analysis • Reading Levels – Lexile
Lexile Scores • Most widely adopted reading measure • Tens of thousands of books and tens of millions of articles have Lexile measures • All major standardized tests can report student reading scores in Lexiles. • Gives teachers, parents, and students confidence to choose materials that will improve student reading skills across school subjects and at home.
Support at Home • www.lexile.com • Book Wizard at http://bookwizard.scholastic.com
Lexile Score Examples 4th Grade 5th Grade 6th Grade
Math • MAP for Primary Grades (K-1) Measures: • Problem Solving • Number Sense • Computation • Measurement and Geometry • Statistics and Probability • Algebra • MAP for Grades 2-8 Measures: • Number Sense and Operations • Patterns, Functions, and Algebra • Measurement • Geometry and Spatial Sense • Data Analysis, Statistics, and Probability • Problem Solving
Using Results to Drive Learning • Students test twice per year to measure growth • Reports are cumulative to show growth over time
Nuts and Bolts of Testing • Grades K-5 tested in math (fall and spring) • Grades 3-5 tested in reading (fall and spring) • Teachers are still learning how to use the data to inform their instruction once their students have been tested • initial data is available to teachers 24 hours after the testing; • complete data is available at the end of the testing window • At the end of the year we will have access to reports that compare students’ performance (fall to spring)