Download
1 / 25
270 likes | 393 Vues
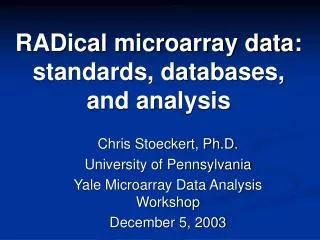
Microarray Databases. Ka-Lok Ng Asia University. Microarray Databases. Time series data – yeast cell cycle Stanford Genomic Resources - Stanford Microarray Database (SMD) yeast cell cycle analysis project Yeast database - SGD Human Cell Cycle and Their Expression in Tumors.

E N D
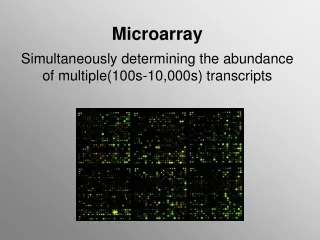
Microarray Databases Ka-Lok Ng Asia University
Microarray Databases • Time series data – yeast cell cycle • Stanford Genomic Resources - Stanford Microarray Database (SMD) • yeast cell cycle analysis project • Yeast database - SGD • Human Cell Cycle and Their Expression in Tumors
Analysis of cell-cycle regulation • Yeast cells stopped at different stages of cell cycle • G1, S, G2, and M • RNA extracted from each stage • Control RNA from unsynchronized culture
Results of cell-cycle analysis • 800 genes identified whose expression changes during cell cycle • Grouped by peak expression • M/G1, G1, S, G2, and M • Four different treatments used to synchronize cells • All gave similar results • Results from Spellman et al., 1998; Cho et al., 1998
Alpha cdc15 cdc28 Elu M/G1 G1 S G2 M Brown and Botstein, 1999 Cell-cycle regulated genes • Each gene is a line on the longitudinal axis • Treatments in different panels • Cell-cycle stages are color coded at top • Vertical axis groups genes by stage in which expression peaks
Time-course microarray data • Why study time-course microarray data ? • Application of time-course microarray data is to group together genes with similar expression patterns. • Genes clustered in the same group are considered to have the potential of conducting similar functions. • Model system – yeast cell cycle
Cell cycle Checkpoints in Cell-Cycle Checkpoint controls function to ensure that chromosomes are intact and that critical stages of the cell cycle are completed before the following stage is initiated. Checkpoint that function in response to DNA damage prevent entry into S to Muntil the damage is repaired. Moderate DNA damage activates p53﹐a TF that stimulates expression of p21CIP. This cyclin-kinase inhibitor then binds to and inhibits all Cdk-cyclin complexes, causing arrest in G1 and G2. One checkpoint operates during S and G2 to prevent the activation of MPF (Mitosis-promoting factor) before DNA synthesis is complete. Another checkpoint operates during early mitosis to prevent the activation of APC (Anaphase-promoting complex) and the initiated of anaphase until the mitotic spindle apparatus is completely assembled and all chromosome kinetochores are properly attached to spindle fibers.
Microarray Databases - SMD • http://genome-www.stanford.edu/ • SMD : Advanced Search Select arrays by by Experimenter, Category, Subcategory and Organism • http://genome-www5.stanford.edu/cgi-bin/search/QuerySetup.pl.
Microarray Databases - SMD • Spellman, yeast cell cycle time series data • Alpha factor block data – every 7 min., 18 time points • Cdc15 data – 24 time points • Cdc28 data – every 10 min., 17 time points • Elu data – every 30 min.,14 time points
Microarray Databases - yeast cell cycle analysis project • yeast cell cycle analysis project http://genome-www.stanford.edu/cellcycle/ or http://www.cs.sunysb.edu/~skiena/gene/jizu/ • The web site provides the alpha factor block, cdc15, cdc28 and elu data set • Keyword searching using "regul* on YPD database as of Feb. 2000 yielded 1007 genes. • By reviewing the published literature on these 1007 genes, 888 transcriptional regulations were collected, of which 647 were activators and 241 were inhibitions (647+241=888). • 469/155 known transcription activations/inhibitions in cdc28 data set • 343/96 known transcription activations/inhibitions in alpha data set • Download the Tab delimited data • Use the Tab delimited option in Excel to store the data
Microarray Databases - yeast cell cycle analysis project • the Pearson correlation coefficient of the gene YLR256W and YPL028W in the alpha factor block data set is -0.5094 anti-correlate • Spearman correlation coefficient is -0.5698 anti-correlate
Microarray Databases - yeast cell cycle analysis project • time series plot
Finding Similar Time Series • Time series are an important class of complex data objects • arise in financial and scientific applications examples include stock price indices, the volume of product sales, telecommunications data, 1D medicalsignals audio data and environmental measurement sequences • Two time series seqs. are similar if they exhibit similar behavior for a large subset of their length. The sequences to be comparedcan have • Outliers, ie values that are measurement errors and should be omitted whencomparing the sequence against others • different scaling factors and baselines the sequences can be due tomeasurements doneusing different devices and the scaling and baseline values canbe different • That is if we have a sequence X and modify it to sequence X’ by introducing outliers by scaling and translation and by adding or removing some observations the sequences X and X’ should still be considered reasonably similar References Gautam Das, Dimitrios Gunopulos, Heikki Mannila (1996), Finding Similar Time Series. Principles of Data Mining and Knowledge Discovery. 陳延洛,"基因表現時間序列的叢集分析方法與系統實作", 國立成功大學資訊工程研究所碩士論文,2003
Finding Similar Time Serieshttp://www.cs.sunysb.edu/~skiena/gene/jizu/ Now HAP1 is 137
Finding Similar Time Series PCC rank 331 among 343 genes
Finding Similar Time Series • Remove the last point in YLR256W (GO: HAP1) and the first point in YPL028W (GO: ERG10) • pcc changes from -0.5094 to 0.6233 correlate • src changes from to -0.5698 0.6169 correlate
Yeast database - SGD SGD - http://www.yeastgenome.org/
Cancer Gene Expression Database • CGED (Cancer Gene Expression Database) is a database of gene expression profile and accompanying clinical information. • http://cged.genes.nig.ac.jp/ • CGED includes data on breast, colorectal, hepatocellular, esophageal, thyroid, and gastric cancers. • Follow “Information” to get the flat file data
Cancer Gene Expression Database Liver cancer data
Human Cell Cycle Genes Expression Data • Genes Periodically Expressed in the Human Cell Cycle and Their Expression in Tumors http://genome-www.stanford.edu/Human-CellCycle/Hela/ • Over 850 genes showed periodic variation during the cell cycle • Hierarchical clustering of the gene expression patterns revealed co-expressed groups of genes involved in cell cycle processes such as DNA replication, chromosome segregation, and cell adhesion • Most of the genes whose expression had previously been reported to correlate with the proliferative state of tumors were found herein also to be periodically expressed during the HeLa cell cycle.
Human fibroblasts Genes Expression Data • http://www-sequence.stanford.edu:16080/human_cell_cycle/ • Fibroblasts (纖維母細胞) prepared from human skin • synchronized in late G1 using a double thymidine-block protocol • Cultures were then released from arrest, and cells were collected every 2 hours for 24 hours, covering nearly 2 complete cell cycles. • identified approximately 700 genes that display transcriptional fluctuation with a periodicity consistent with that of the cell cycle. Reference • Cho et al. (2001) Nature Genetics27, 48 - 54
Human fibroblasts Genes Expression Data • functional analysis results from the human cell cycle experiments • How to study the biological functions ? • Fibroblasts cell expose to the following changes • E7 – transfection with the E7 oncoprotein • MMS – methyl methane sulfonate • UV – ultraviolet light