Download
1 / 27
270 likes | 406 Vues
14 th TRB National Transportation Planning Applications Conference May 5-9, 2013, Columbus, Ohio. Linking Land Use & Travel in Ohio. Dr. Gulsah Akar 1 , Dr. Steven I. Gordon 2 & Yuan Zhang 2 1 City & Regional Planning, OSU 2 Ohio Supercomputer Center.

E N D
14th TRB National Transportation Planning Applications Conference May 5-9, 2013, Columbus, Ohio Linking Land Use & Travel in Ohio Dr. Gulsah Akar1, Dr. Steven I. Gordon2 &Yuan Zhang2 1City & Regional Planning, OSU 2Ohio Supercomputer Center Study funded by Ohio Department of Transportation
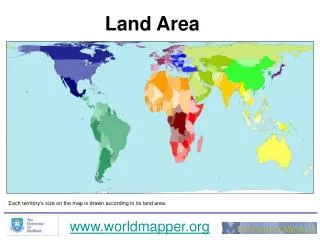
Linking Land Use & Travel in Ohio • Focus on links between land use, transportation infrastructure & travel behavior. • Develop a user-friendly modeling tool to develop forecasts based on different land use, transportation and policy scenarios. • Enhance the existing Land Allocation model developed by MORPC. • Land allocation model gives forecasts of future land development under different scenarios. • Add a transportation component to be able to forecast the implications of future land use and infrastructure decisions on the resulting travel patterns.
Why look at household travel? • Household travel accounts for the vast majority (over 80 percent) of miles traveled on the Nation’s roadways and three-quarters of the CO2 emissions from mobile sources (Federal Highway Administration, 2009). • The carbon footprint of daily travel= • f (types of vehicles, fuel efficiency, number of miles traveled). • There is need to improve our understanding of the links between the land use, transportation policies and individual/household travel behavior to develop sound policies and investment decisions.
Approach • Given a land use scenario: • How many auto-trips will be generated? • What will be the mean trip length? • What will be the resulting VMT? • Data: Household travel surveys across OH. • Approximately 23,000 households • Over 200,000 trips • Two transportation models • Auto trip rates at TAZ level • Auto trip distances at TAZ level
Auto Trip Rates • Estimate auto trip rates at TAZ level as a function of: • Number of households • Retail employment • Industrial employment • Office employment • Other employment • Availability of transit • Dependent variable: Number of auto trips generated at each TAZ. • Outputs of the Statewide Travel Demand Model
Auto Trip rate – Metro Areas N= 2523, Adjusted R2= 0.97
Auto Trip Rate – Rural & Non-metro N= 1137, Adjusted R2= 0.98
Trip Distances • Dependent variable: ln (trip distance) • Function of • TAZ characteristics (employment & population). • Household characteristics at the TAZ level • Job – Household index. • Measures balance between employment and households. Ranges from 0 to 1. It is equal to 0 if only households or employment present, to 1, when there is a perfect mix. In this coming model we assume 1 job per household as perfect mix.
Trip distance model ( ln (distance) ) N= 2878, Adjusted R2= 0.2
Based on MORPC Model • Allocate population and employment to parts of seven county region • Region divided into 40 acre cells • Cells characterized by current land use and factors that would influence future development • Factors used to create score that dictates which cells would develop first • Development capped by regional growth control forecast
MORPC Land Use Model Flow Chart buildout rate for each land use type for each grid (40 acres) Base year HH&Job Future land use type Projecting “Full Built” HH&Job assignment.s Base year HH&Job > “Full Built” Use Base year HH&Job instead of projected “Full Built” Control/“Full Built” for counties/region Apply damping factors to get weighted HH&Job between Base year and projected “Full Built” Relocating factor = 0 Adjusted “Full Built” HH&Job Deciding develop potential for each grid Environmental factors Decide HH&Jobretained Control total for counties/region • Start assignment Assignment Schema Choose control level (county or region) Assign starting from the grid with the highest weighting. Assign until control total is reached Assign starting from the grid with the highest weighting. Grids with higher weighting are more likely to be fully filled, grids with weighting in the middle range are partially filled. Assign until control total is reached Choose assignment method Future HH&Jobfor each grid Post processing ToTAZ.s Convert grid data to TAZ data
Example Scenarios • Historic growth pattern • Typical sprawl development • Low density residential • Scattered strip commercial • Increased density in CBD and satellite cities • Assumes both permission to increase density and market trends in that direction because of rising energy costs • Targets vacant or currently agricultural land uses within incorporated areas in Central Ohio • Moves them from future low density to medium density residential where suitable
Results for Central Ohio Scenario Results in Reduction in VMT by over 2.3 million
Strategies to Deal with Decline • Some areas in Ohio continue to decline in population and employment • Original model provided allocations based on growth • Need to devise process for allocating decline • Using past trends as a guide • Have compiled information on population and employment decline from available data • Population – block level differences in population and households • Employment – zip code level data from County Business Patterns by major sector
Defining Indicators of Change • Decline not evenly distributed • Regions with decline still have some subareas that are growing • Created indicators of growth or decline from historical data • Seven categories of change to set the probability for change • Indicator generated – (3,2,1,0 -1,-2,-3) • Indicates growth or decline for a target cell as well as the strength of the probability • Model adjustments • Choose a cell at random • Decide whether it will grow or decline • Allocate an increment of growth or decline • Check to see whether the new growth or decline has been met • Continue until entire growth or decline is met
Related Issues • Historic growth or decline may not continue • Will need to have comparative scenarios that reflect a range of possible futures • Employment sector decline pattern may also vary over time • E.G. – manufacturing has begun to recover while retail employment may be leveling off • Need for more guidelines for model use since the allocation procedure is more complicated • Must make consistent decisions about future land use, growth or decline, and future land use intensity • Will incorporate the relevant procedures in our final product
Thanks! Questions?
Number of Trips by Region *After dropping the ones with missing OD information, number of trips reduces to 207,230.
Job – Household index. • Measures balance between employment and households. Ranges from 0 to 1. It is equal to 0 if only households or employment present, to 1, when there is a perfect mix. In this coming model we assume 1 job per household as perfect mix. JOB_HH = 1 - [ABS (employment - households) / (employment + households)]