Download
1 / 26
260 likes | 348 Vues
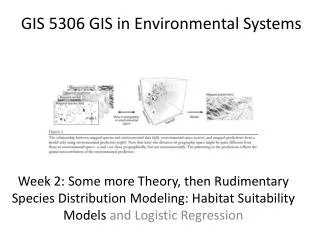
Educational framework Student participation Web-based GIS Field-based GIS Desktop-based GIS GIS analysis using Environmental data Wind data Torben P. Jensen Edugis Website: www.gogis.dk. GIS in wind energy and environmental studies - Danish High Schools.

E N D
Educational framework Student participation Web-based GIS Field-based GIS Desktop-based GIS GIS analysis using Environmental data Wind data Torben P. Jensen Edugis Website: www.gogis.dk GIS in wind energy and environmental studies - Danish High Schools
GIS and student participation • Good ICT-functionality and knowledge sharing • Teaching teams cooperating closely and openly • Well-structured teaching models wíth sub-categories
The extension and use of the internet in Denmark • A growing number of private citizens in Demark have access to the internet • 1999-2003: from 50 % to 77 % • 12 to 19 age group: 97 % • 60 to 69 age group: 44 % • over 70 age group: 21% • All schools in a single Sector network • All schools have web sites • Communication platform for all schools “Skolekom” using First Class - more than 300,000 users .
The three classical learning rooms • The classroom • The study room • The training room
Exploration room – new room • From learning objectives to product • Interchange of classroom theory and field work in the exploration room • Use of ICT and selected digital learning objectives in the exploration room • Learning objectives and product demands determine student participation and student activities in the exploration room
Learning styles • The Activist • Motto: We must learn by doing and testing. • The Theoretician • Motto: We must adjust practice to the best theory. • The Pragmatist • Motto: The theory must work in practice – or we’ll make a new theory. • The Reflective • Motto: We must look at the problem from all angles.
Teaching model • Problem • Background • Exercises • Links
Learning categories • Experience • Insights • Source • Methods • Express • Exercise
Web-based GIS with local data • Digital Atlas – Local area: Students often see and understand the possibilities in GIS
Ortho photo in GIS • GIS can show Ortho photo in a Geographical Information System • Example from Klim
Ortho photo with GIS analysis by students • A GIS project can visualize the collected data in a map • On top of an Ortho photo the students may draw the outlines of a building and add new information about every location.
Ortho photo with GIS-data • The same GIS project again • Not the map, but part of the data base made by the students is shown here
Environmental pollution at Mundelstrup • The 1980s: more than 20 sites were depolluted. The toxic soil was removed and new soil put on
Map of the fertilizer factory - the source of pollution • Fertilizer factory (1888-1924) • Map from about 1900
GIS analysis using environmental data • Environmental issues near Mundelstrup, Denmark
Field-based GIS - using pda (iPAQ) and ArcPad • iPAQ og ArcPad can be used to collect and store data from the satellites • The data can be used in the GIS programs.
From spread sheet to GIS project • The students make spread sheets with information on every locality, environmental conditions such as water pollution etc. • The spread sheet is imported into ArcView and the program shows the different contents of the legends
Polluted plots of land • The Municipality of Aarhus, Denmark
Students’ GIS reports on the pollution. • GIS data can be exchanged via mail and conference systems like First Class.
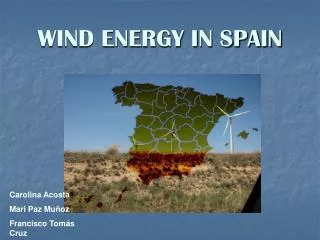
Wind energy in Europe • Wind energy Production in 2002
GIS query - wind velocity • Find the best locations for wind mills
Links • www.gogis.dk • www.gogis.dk/03/mundelstrup • www.itmf.dk/itmf160 • www.skolegis.dk/best • www.gogis.dk/natgis/vind/