Download
1 / 39
390 likes | 479 Vues
Digital Filters. Part A characterization and analysis.

E N D
Digital Filters Part A characterization and analysis
“As soon as we started programming, we found out to our surprise that it wasn't as easy to get programs right as we had thought. Debugging had to be discovered. I can remember the exact instant when I realized that a large part of my life from then on was going to be spent in finding mistakes in my own programs.” • Maurice Wilkes (a pioneering British computer scientist, winner of the 1967 Turing Award, developed the first stored-program computer in 1949, invented the concept of microprogramming in 1951, credited with originating the fundamental software concepts of symbolic labels, macros, and subroutine libraries; from wikipedia)
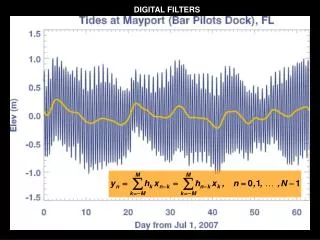
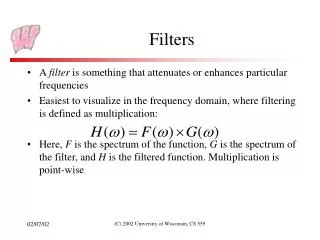
What have we seen so far? • So far we have seen… • Box filter • Moving average filter • Example of a lowpass • passes low frequencies • small, gradual changes in the signal are passed • higher frequencies are attenuated (reduced/removed/suppressed)
Applied by cross correlation (sum of products) of image f and mask h If mask is centered about origin, (x,y) in image: If origin, (x,y), in image is aligned with (0,0) in mask:
But how do we know what the application of an arbitrary mask actually does to the image?
For simplicity, let us just consider 1D signals (e.g., mono audio)
Our moving average (box) filter Example of a lowpass filter (passes low frequencies, attenuates high frequencies) y[n] = 1/3 x[n-1] + 1/3 x[n] + 1/3 x[n+1] More generally, y[n] = h[-1] x[n-1] + h[0] x[n] + h[1] x[n+1]
Lowpass filters X Input: (before) x(t) = 0.5*sin(t) + sin(3*t+pi/3) + sin(5*t+pi/8) Output: (after) y(t) = 0.5*sin(t) + sin(3*t+pi/3)
So how can we determine how our moving average filter behaves? • 11 point and 51 point moving average filters (on the previous slide) obviously produce different outputs even when given the same input! • Answer: By determining how a particular filter responds to an impulse (their impulse response function).
So given …,h[-1],h[0],h[1],… how can we plot the impulse response? • Perform the z-transform (the discrete version of the Laplace transform) of h resulting H. • Plot H on the unit circle. The magnitude of H (abs(H) or |H|) is amplitude and the angle of H (arg(H)) is the phase. • Say we have a 3 point box filter: h[-1] = h[0] = h[1] = 1/3.
So given …,h[-1],h[0],h[1],… how can we plot the impulse response? • Say we have an 11 point box filter: h[-5]=h[-4]=h[-3] =h[-3] =h[-2] =h[-1] =h[0] =h[1] =h[2] =h[3] =h[4] =h[5]=1/11.
dB(from http://www.animations.physics.unsw.edu.au/jw/dB.htm) “The decibel (dB) is used to measure sound level, but it is also widely used in electronics, signals and communication. The dB is a logarithmic way of describing a ratio. The ratio may be power, sound pressure, voltage or intensity or several other things.” “One decibel is close to the Just Noticeable Difference (JND) for sound level. Experimentally it was found that a 10 dB increase in sound level corresponds approximately to a perceived doubling of loudness.”
Frequency response (dB) and phase of 3 and 11 point box filters.
3 point box filter (blue) vs. 3 point gaussian (green)(normal – left, dB – below)
Spectral inversion:How to make a highpass filter the easy way. • Change the sign of each sample in the filter kernel. • Add 1 to the sample at the center of symmetry. • highpass lowpass • lowpass highpass • bandpass bandreject (stopband) • bandreject bandpass
Spectral inversion:How to make a highpass filter the easy way. • Change the sign of each sample in the filter kernel. • Add 1 to the sample at the center of symmetry. Ex. lowpass box highpass
Lowpass followed by highpass = bandpass (more efficient implementation)
Bandreject (stopband) = lowpass + highpass (lowpass or highpass) (more efficient implementation)