Download
1 / 1

E N D
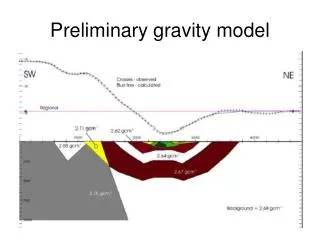
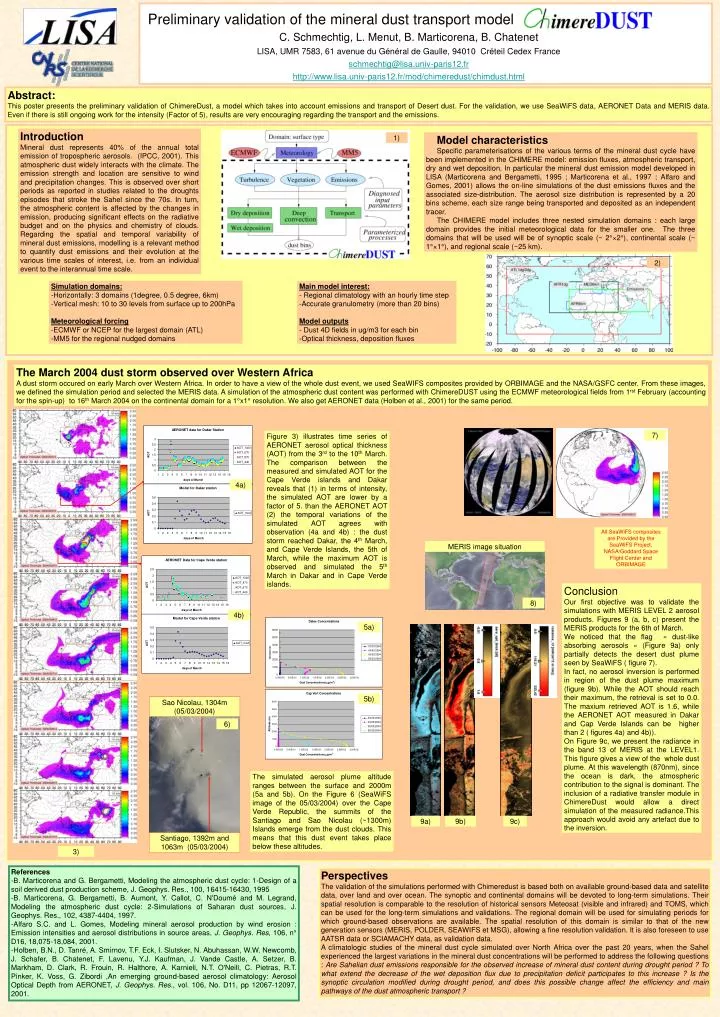
Introduction Mineral dust represents 40% of the annual total emission of tropospheric aerosols. (IPCC, 2001). This atmospheric dust widely interacts with the climate. The emission strength and location are sensitive to wind and precipitation changes. This is observed over short periods as reported in studies related to the droughts episodes that stroke the Sahel since the 70s. In turn, the atmospheric content is affected by the changes in emission, producing significant effects on the radiative budget and on the physics and chemistry of clouds. Regarding the spatial and temporal variability of mineral dust emissions, modelling is a relevant method to quantify dust emissions and their evolution at the various time scales of interest, i.e. from an individual event to the interannual time scale. 1) Model characteristics Specific parameterisations of the various terms of the mineral dust cycle have been implemented in the CHIMERE model: emission fluxes, atmospheric transport, dry and wet deposition. In particular the mineral dust emission model developed in LISA (Marticorena and Bergametti, 1995 ; Marticorena et al., 1997 ; Alfaro and Gomes, 2001) allows the on-line simulations of the dust emissions fluxes and the associated size-distribution. The aerosol size distribution is represented by a 20 bins scheme, each size range being transported and deposited as an independent tracer. The CHIMERE model includes three nested simulation domains : each large domain provides the initial meteorological data for the smaller one. The three domains that will be used will be of synoptic scale (~ 2°×2°), continental scale (~ 1°×1°), and regional scale (~25 km). 2) Simulation domains: -Horizontally: 3 domains (1degree, 0.5 degree, 6km) -Vertical mesh: 10 to 30 levels from surface up to 200hPa Meteorological forcing -ECMWF or NCEP for the largest domain (ATL) -MM5 for the regional nudged domains Main model interest: - Regional climatology with an hourly time step -Accurate granulometry (more than 20 bins) Model outputs - Dust 4D fields in ug/m3 for each bin -Optical thickness, deposition fluxes 4a) MERIS image situation 4b) Sao Nicolau, 1304m (05/03/2004) 6) Santiago, 1392m and 1063m (05/03/2004) 9a) 9b) 9c) Preliminary validation of the mineral dust transport model C. Schmechtig, L. Menut, B. Marticorena, B. Chatenet LISA, UMR 7583, 61 avenue du Général de Gaulle, 94010 Créteil Cedex France schmechtig@lisa.univ-paris12.fr http://www.lisa.univ-paris12.fr/mod/chimeredust/chimdust.html Abstract: This poster presents the preliminary validation of ChimereDust, a model which takes into account emissions and transport of Desert dust. For the validation, we use SeaWiFS data, AERONET Data and MERIS data. Even if there is still ongoing work for the intensity (Factor of 5), results are very encouraging regarding the transport and the emissions. The March 2004 dust storm observed over Western Africa A dust storm occured on early March over Western Africa. In order to have a view of the whole dust event, we used SeaWIFS composites provided by ORBIMAGE and the NASA/GSFC center. From these images, we defined the simulation period and selected the MERIS data.A simulation of the atmospheric dust content was performed with ChimereDUST using the ECMWF meteorological fields from 1rst February (accounting for the spin-up) to 16th March 2004 on the continental domain for a 1°x1° resolution. We also get AERONET data (Holben et al., 2001) for the same period. 7) Figure 3) illustrates time series of AERONET aerosol optical thickness (AOT) from the 3rd to the 10th March. The comparison between the measured and simulated AOT for the Cape Verde islands and Dakar reveals that (1) in terms of intensity, the simulated AOT are lower by a factor of 5. than the AERONET AOT (2) the temporal variations of the simulated AOT agrees with observation (4a and 4b) : the dust storm reached Dakar, the 4th March, and Cape Verde Islands, the 5th of March, while the maximum AOT is observed and simulated the 5th March in Dakar and in Cape Verde islands. All SeaWiFS composites are Provided by the SeaWiFS Project, NASA/Goddard Space Flight Center and ORBIMAGE Conclusion Our first objective was to validate the simulations with MERIS LEVEL 2 aerosol products. Figures 9 (a, b, c) present the MERIS products for the 6th of March. We noticed that the flag « dust-like absorbing aerosols » (Figure 9a) only partially detects the desert dust plume seen by SeaWiFS ( figure 7). In fact, no aerosol inversion is performed in region of the dust plume maximum (figure 9b). While the AOT should reach their maximum, the retrieval is set to 0.0. The maxium retrieved AOT is 1.6, while the AERONET AOT measured in Dakar and Cap Verde Islands can be higher than 2 ( figures 4a) and 4b)). On Figure 9c, we present the radiance in the band 13 of MERIS at the LEVEL1. This figure gives a view of the whole dust plume. At this wavelength (870nm), since the ocean is dark, the atmospheric contribution to the signal is dominant. The inclusion of a radiative transfer module in ChimereDust would allow a direct simulation of the measured radiance.This approach would avoid any artefact due to the inversion. 8) 5a) 5b) The simulated aerosol plume altitude ranges between the surface and 2000m (5a and 5b). On the Figure 6 (SeaWiFS image of the 05/03/2004) over the Cape Verde Republic, the summits of the Santiago and Sao Nicolau (~1300m) Islands emerge from the dust clouds. This means that this dust event takes place below these altitudes. 3) References -B. Marticorena and G. Bergametti, Modeling the atmospheric dust cycle: 1-Design of a soil derived dust production scheme, J. Geophys. Res., 100, 16415-16430, 1995 -B. Marticorena, G. Bergametti, B. Aumont, Y. Callot, C. N'Doumé and M. Legrand, Modeling the atmospheric dust cycle: 2-Simulations of Saharan dust sources, J. Geophys. Res., 102, 4387-4404, 1997. -Alfaro S.C. and L. Gomes, Modeling mineral aerosol production by wind erosion : Emission intensities and aerosol distributions in source areas, J. Geophys. Res, 106, n° D16, 18,075-18,084, 2001. -Holben, B.N., D. Tanré, A. Smirnov, T.F. Eck, I. Slutsker, N. Abuhassan, W.W. Newcomb, J. Schafer, B. Chatenet, F. Lavenu, Y.J. Kaufman, J. Vande Castle, A. Setzer, B. Markham, D. Clark, R. Frouin, R. Halthore, A. Karnieli, N.T. O'Neill, C. Pietras, R.T. Pinker, K. Voss, G. Zibordi ,An emerging ground-based aerosol climatology: Aerosol Optical Depth from AERONET, J. Geophys. Res., vol. 106, No. D11, pp 12067-12097, 2001. Perspectives The validation of the simulations performed with Chimeredust is based both on available ground-based data and satellite data, over land and over ocean. The synoptic and continental domains will be devoted to long-term simulations. Their spatial resolution is comparable to the resolution of historical sensors Meteosat (visible and infrared) and TOMS, which can be used for the long-term simulations and validations. The regional domain will be used for simulating periods for which ground-based observations are available. The spatial resolution of this domain is similar to that of the new generation sensors (MERIS, POLDER, SEAWIFS et MSG), allowing a fine resolution validation. It is also foreseen to use AATSR data or SCIAMACHY data, as validation data. A climatologic studies of the mineral dust cycle simulated over North Africa over the past 20 years, when the Sahel experienced the largest variations in the mineral dust concentrations will be performed to address the following questions : Are Sahelian dust emissions responsible for the observed increase of mineral dust content during drought period ? To what extend the decrease of the wet deposition flux due to precipitation deficit participates to this increase ? Is the synoptic circulation modified during drought period, and does this possible change affect the efficiency and main pathways of the dust atmospheric transport ?