Download
1 / 107
1.07k likes | 1.08k Vues
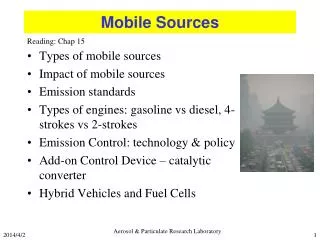
MOBILE SOURCES 101 2005. NESCAUM Presented by: Rob Klausmeier de la Torre Klausmeier Consulting, Inc Harold Garabedian Vermont Agency of Natural Resources. What will be covered?. Day 1: Overview of Mobile Sources Day 2: Mobile Source Control Strategies Day 3: I/M Programs and OBDII

E N D
MOBILE SOURCES 1012005 NESCAUM Presented by: Rob Klausmeier de la Torre Klausmeier Consulting, Inc Harold Garabedian Vermont Agency of Natural Resources
What will be covered? • Day 1: Overview of Mobile Sources • Day 2: Mobile Source Control Strategies • Day 3: I/M Programs and OBDII • Day 4: MOBILE Modeling
SESSION A Overview of Mobile Sources • Description of mobile sources • Air pollution problems caused by mobile sources. What will be covered:
"Light-duty vehicles" (LDVs) - passenger cars or passenger car derivatives capable of seating twelve or fewer persons. "Light-duty trucks" (LDTs) - vehicles having a manufacturer's rated gross vehicle weight (GVWR) of 8,500 pounds or less that are designed primarily for transportation of cargo, for carrying more than twelve persons DESCRIPTION OF MOBILE SOURCESOn-Road Vehicles
On-Road Vehicles cont. “Heavy-duty vehicle” (HDV) - any road vehicle with GVWR greater than 8,500 pounds, curb (empty) weight greater than 6,000 pounds • HDVs with GVWR between 8,500 and 14,000 lb are considered "light-heavy" duty vehicles (LHDV), • Those between 14,000 and about 33,000 lb. GVWR are considered "medium-heavy" duty (MHDV), and • Those over about 33,000 lb GVWR are considered "heavy-heavy" duty vehicles (HHDV).
DESCRIPTION OF MOBILE SOURCESNon-Road Vehicles • Recreational vehicles, such as all-terrain vehicles and off-road motorcycles; • Logging equipment, such as chain saws; • Agricultural equipment, such as tractors; • Construction equipment, such as graders and back -hoes; • Industrial equipment, such as fork lifts and sweepers; "Nonroad" is a term that covers a diverse collection of engines, equipment, and vehicles. Also referred to as "off-road" or "off-highway," the nonroad category includes vehicles and equipment in the following categories:
Non-Road Vehicles cont. • Residential and commercial lawn and garden equipment, such as leaf and snow blowers; • Recreational and commercial marine vessels, such as power boats and oil tankers; • Locomotive equipment, such as train engines; and • Aircraft, such as jets and prop planes.
Motor Vehicles Contribute to the Following Contemporary Air Pollution Problems: • Ozone/Smog • Fine Particulate Matter • Airborne Toxins • Acid Rain • Visibility/Haze • Climate Change/Global Warming
Criteria Air Pollutants • Sec. 109 of the Clean Air Act – directed EPA to establish standards based upon criteria. • Congress directed that EPA adopt National Ambient Air Quality Standards to protect the public health … ‘allowing for an adequate margin of safety’. • Six standards adopted: • Sulfur Dioxide (SO2) Nitrogen Dioxide (NO2) • Particulate Matter (PM) Ozone (O3) • Carbon Monoxide (CO) Lead (Pb)
Air Quality *This number is based on PM2.5 monitors with complete data. Because the national PM2.5 monitoring network was still being deployed in 2000, some counties with PM2.5 monitors have incomplete data for 2000. Since it is likely that more monitors will have complete data as time goes by, this number may increase as this information becomes available.
OZONE Ozone is an irritant and damages lung tissue. Many areas in the Southwest exceed the National Ambient Air Quality Standard (NAAQS) for ozone.
AMBIENT OZONE STANDARD Current 1 Hour Standard -- An area is non-attainment for the 1 Hour Ozone Standard if the average number of 1-Hour exceedences (>0.12 ppm) is greater than 1.0. Future 8 Hour Standard -- An area is non-attainment for the 8 Hour Ozone Standard if the three year average of the annual 4th maximum 8-hour daily maximum ozone concentration is greater than 0.08 ppm.
FORMATION OF OZONE Ozone is formed by photochemical reactions in the atmosphere between volatile organic compounds (VOCs) and oxides of nitrogen (NOx). The formation of ozone is a complex process influenced by several factors, including the following: • The concentration and reactivity of VOCs in the atmosphere and their subsequent reaction products; • The concentration of NOx in the atmosphere; • Regional transport of emissions and ozone; • Ambient temperature; and • Solar radiation.
VOC vs. NOx CONTROLS The relative effectiveness of NOx or VOC controls in reducing ozone depends on many factors: • Determining the appropriate strategy requires regional photochemical grid modeling, considering all the factors including long-range pollutant transport. • In most cases, NOx reductions are beneficial in reducing average ozone levels. VOC reductions are useful in reducing peak ozone levels. Often, both VOC and NOx reductions are needed. • Air quality modelers use to believe that the appropriate strategy depended on the VOC/ NOx ratio, but this approach is no longer used to develop ozone control strategies.
MOBILE SOURCE VOC AND NOx EMISSIONS • Mobile sources emit VOCs as either tailpipe or evaporative emissions. • Tailpipe emissions occur as a result of incomplete combustion and/or chemical reactions during combustion. • NOx is largely produced by reactions between nitrogen and oxygen present in air at high temperatures. • In 1996, approximately one-half of the anthropogenic VOC and two-thirds of the NOx emissions came from mobile sources
Diesel Pollution • 26% of highway NOx (from 2% of vehicles) • Most non-road NOx is from diesels. • 80 percent of mobile source (non-road/highway) PM emissions • 90 percent of diesel PM is fine particles • PM labeled Toxic Air Contaminant by CARB and a probable human carcinogen by EPA • Contribute significantly to toxics inventory (40 carcinogens)
PROGRESS HAS BEEN MADE IN REDUCING OZONE
Trend in Number of Annual Exceedances of the Federal 1-hour Ozone Standard in the South Coast Air Basin from 1976 to 1999 1st CRC Workshop
PM2.5 • EPA has recently established standards for ambient levels of PM2.5 based upon concerns over the health effects of fine particulate matter. • PM2.5 is defined as particulate matter less than 2.5 microns in diameter. • In addition to their potential to cause cancer, fine particulate matter has other health effects including increased mortality and aggravation of existing respiratory and cardiovascular disease, as evidenced by increased hospitalization, school absences, and work loss days.
Urban Sites 7.3 10.3 8.9 7.2 Rural Sites (mostly IMPROVE) Rural Sites (mostly NEPART) 5.8 8.0 6.5 8.0 4.2 6.9 7.5 14.6 16.2 13.0 12.8 14.9 13.7 10.7 9.4 11.4 14.1 16.1 14.3 11.2 11.6 16.2 15.1 24 - 33 11.3 Average PM2.5 Concentrations (ug/m3) in the NESCAUM Region (Most recent 1-3 year average during 1991-98 period)
MOBILE SOURCE PM2.5 EMISSIONS • Mobile sources emit PM2.5 directly and indirectly. • Direct emissions include organic and elemental carbon emitted by diesels and gasoline powered vehicles. Diesel powered vehicles emit over 80% of the direct PM2.5 emissions from mobile sources. • Indirect emissions include secondary particulate matter formed by atmospheric actions with nitrogen oxides and sulfur oxides. About a third of the mobile source nitrogen and sulfur oxide emissions are from diesels, the remainder is from gasoline powered vehicles. • Control of mobile source emissions is expected to play a key role in compliance with PM2.5 standards.
Inventory Background NOx Emissions PM Emissions* *urban PM emissions measured in New York City
Visibility/Haze July 14, 1982. Sulfate < 1 ug/m3; 35 miles visibility July 15, 1982. Sulfate 6 ug/m3; 13 miles visibility July 16, 1982. Sulfate 13 ug/m3; 6.8 miles visibility July 17, 1982. Sulfate 35 ug/m3; <5 miles visibility
CARBON MONOXIDE • The health effects of exposure to CO vary depending upon the length and intensity of exposure and the health of the individual. • Healthy individuals may experience impairment of visual perception, thought, and reflexes as well as drowsiness with longer exposures at high levels. • People with cardiovascular disease may experience significantly impaired cardiovascular function.
MOBILE SOURCE CO EMISSIONS • Motor vehicles account for over half of carbon monoxide (CO) emissions. • When exposure is considered, motor vehicles account for an even higher percentage of CO. • Most states are in attainment of the National Ambient Air Quality Standards for CO. • This has largely been achieved through the massive reductions in CO emissions from motor vehicles. • Motor vehicles will continue to be the largest contributor to the CO inventory, even though CO emission factors and total CO levels will continue to drop in the future.
AIR TOXIC EMISSIONS Air toxics are non-criteria pollutants, which are suspected of carcinogenic or other health effects based on epidemiological, human clinical and animal toxicology studies. Motor vehicles are a key source of many of the toxic compounds of concern. Air toxic emissions occur because the compounds are either present in the fuel, formed during combustion of the fuel, or both. • Benzene, a known carcinogen, is present in gasoline so it can be emitted due to evaporation or incomplete combustion. • However, estimates indicate that over half the benzene in the exhaust is formed during combustion by chemical reactions. • The absence of a toxic compound in the fuel does not prohibit the compound from existing in the exhaust.
National-Scale Air Toxic Assessment • Mobile Source Risk Drivers (Cancer / Noncancer): Pollutants Percent of Total 1996 Inventory • Benzene 76% • Acetaldehyde 70% • 1,3-Butadiene 60% • Formaldehyde 49% • Acrolein 39% • POM 6% • Chromium 4% • Arsenic 1% • Manganese 1%
1997 Annual Average Ambient Measurements • Ambient concentrations of acetaldehyde, benzene, 1,3-butadiene, and formaldehyde currently each exceed 1 in 1 million cancer risk thresholds in all locations in the Northeast. • Benzene, 1,3-butadiene, and formaldehyde also each exceed 1 in one hundred thousand cancer risk thresholds in the majority of areas in the Northeast.