Download
1 / 16
160 likes | 277 Vues
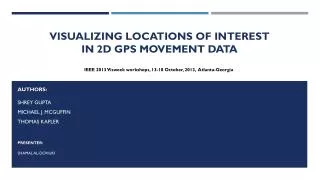
Visualizing Locations of Interest in 2D GPS Movement Data. Authors: Shrey Gupta Michael J. McGuffin Thomas Kapler Presenter: Shamal AL-dohuki. IEEE 2013 Visweek workshops, 13-18 October, 2013, Atlanta-Georgia. Outline. Abstract Introduction The aim of the paper Data Set

E N D
Visualizing Locations of Interest in 2D GPS Movement Data Authors: Shrey GuptaMichael J. McGuffinThomas Kapler Presenter: Shamal AL-dohuki IEEE 2013 Visweek workshops, 13-18 October, 2013, Atlanta-Georgia
Outline • Abstract • Introduction • The aim of the paper • Data Set • The Proposed Model
Abstract • This Paper describe an interactive visualization of 2-dimensional movement data, such as GPS data captured by smartphones. • The raw data is analyzed to identify places of interest (such as buildings visited) and to also identify meetings between people (i.e., where two or more smartphones coincided in space and time). • The data is visualized using two coordinated views: a 2D geographic map, and a Gantt chart.
Introduction • Technologies such as smartphones equipped with GPS receivers have led to a rise in the availability of movement data (sequences of locations over time) for people and vehicles. • Visualizing such data, especially for multiple moving objects, is challenging because of the multiple variables involved (latitude and longitude as functions of time and person or object identifier) and also because long time spans may be involved (e.g., weeks or months). • many meaningful movements may occur, for example, exhibit repeated trajectories and repeated visits to the same locations (home and work, or less frequently, stores and friends’ homes), and different people may move along the same paths or visit the same locations at the same or different times.
Introduction (cont.) • One popular tool for such movement data is Google Latitude, which uses as its main view a 2D geographic map. • Movements are plotted on this map, showing where a person has been. • The problem is when data over many weeks are displayed, leading to occlusion (overplotting).
Introduction (cont.) • An alternative approach, used in the commercial product GeoTimeR, is to map latitude, longitude, and time to the three axes of a fully 3-dimensional space.
The aim of this paper • This research focuses on visualizing higher-level information that has been extracted from raw movement data, namely: the locations visited by people, and meetings between multiple people, without visualizing detailed trajectories. • This paper developed a prototype called MovementSlicer that uses a new technique, called snakes, for linking its 2D views, and they are exploring ways to display meetings within MovementSlicer.
Data set • Six people in our research team tracked their movements over a 1 month period, while traveling to and from work, and occasionally meeting in places outside work such as restaurants. Our implementation is able to read in this data (135k raw points, or roughly 1 point every 2 minutes), containing gaps and noise, and process it to find visited locations in under 5 seconds on a recent laptop.
The proposed model • The researcher adopted two strategies to visualize the locations visited by people, and meetings between multiple people using Gantt chart: • 1- The chart below clearly distinguishes people with colors, and clearly shows a meeting between the red and blue individual.
The proposed model (cont.) • 2- Each individual has their own subset of rows showing their locations. Note that with this strategy, the color coding of people is no longer necessary, and is not used in our prototype.
The proposed model (cont.) • The Gantt chart can answer questions such as: • “What places are most often visited by this person?”. • “How many times did they visit this place?”. • “In what order did they visit these places?”. • “Who among these people often meet together?”. • “Where do they meet?”. • “Who is early or late for a meeting?”.
The proposed model (cont.) • The researcher draw a curved (or straight) segment between the centers of the two intervals. Curves seem to work better for meetings with few people, and straight line segments for larger groups.
The proposed model (cont.) • Figure below shows the user interface, with 2 people displayed in the Gantt chart. The number of rows per person in the Gantt chart can be adjusted. For example, with 6 rows per person (Figure 2), the first 5 rows are used for the 5 most frequently visited locations, and the 6th row is used to display all “Other” locations visited by the person.
The proposed model (cont.) • We developed a novel technique called snakes to highlight part of the sequence of locations traversed by a person. • in the Gantt chart, the intervals for each person are linked by a polyline, and part of one person’s polyline is in bold: this is the person’s snake, whose locations are highlighted in the geographic map and linked together by orange line segments.