Download
1 / 31
320 likes | 454 Vues
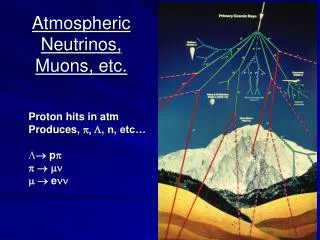
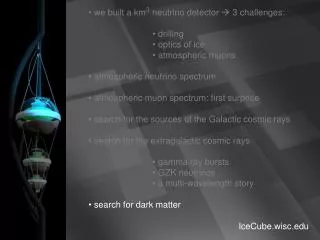
Dmitry Chirkin. Atmospheric muons in neutrino detector AMANDA. chirkin@physics.berkeley.edu University of California at Berkeley, Berkeley, CA 94720, USA. LBL, July 8 2004. South Pole. AMANDA-II. Particles observed by AMANDA-II. Down-going muons observed by AMANDA-II.

E N D
Dmitry Chirkin Atmospheric muons in neutrino detector AMANDA chirkin@physics.berkeley.edu University of California at Berkeley, Berkeley, CA 94720, USA LBL, July 8 2004
South Pole AMANDA-II
Muon propagator (MMC) settings: ph-nu settings photoproduction DIS Q2 soft hard 1 GeV2 Abramowicz Levin Levy Maor Bezrukov-Bugaev Butkevich-Mikheyev BB 1981 2002 1991 1997 ZEUS 94 Nuclear effects BB + Hard 03 Bugaev Shlepin Kokoulin 99 Dutta Smirnov
Properties of muon energy spectrum at the depth of the AMANDA-II detector • Simple 1d model • Full CORSIKA+MMC simulation • Observed muon flux calculation • Fits to the Nch distribution • Results for cosmic ray flux • Calculation of muon flux on the surface • Energy range of result validity • Muon multiplicity effect on the results
Detailed description of the energy loss model • Etop < 100 GeV: • muon stops inside detector • up to ~ 500 GeV losses • are continuous, • indep. of Etop • after ~ 1TeV losses • are prop. to Etop, • slope decreases • at small energies muon • energy losses are well • defined (deterministic) • since they are mostly • continuous
Fits to the Nch distribution To extract the features of the Nch distribution, it was fit with , with x=Nch , where x=log10(Nch)
Noise cleaning in the Nch distribution • average noise l ~4 • n is high (n~40>> l) • a and b are slowly • varying functions • of n • b is small (b~0.1) It is sufficient to shift the fit by l to correct Nch for noise
Observed muon flux calculation muon signal = OM signal – noise + missed signal raw 1-Pt = (1-Ps) (1-Pn) calibrated Nmuon sig. = Ps Nall • this works for: • single OM • several OMs
Observed muon flux calculation: layered model OM X efficiency: muon number at X: To get noise-corrected numbers for set intersections use
Observed muon flux calculation: improved layered model for the total number of events P(X) with muons seen at X: if 1 and 2 are very large then OM X’s effective sensitivity is X/P(X)
Method 1 z [m] z [m]
Method 2 normalization: z [m] z [m]
Seasonal variations and detector configuration uncertainties spectral index correction Normalization (flux at 1 TeV) in spectral index correction coordinate transformation
Results For QGSJET (only H component values are shown, for relative abundances taken from Wiebel-Sooth) method 1 Values shown are for DPMJET, HDPM, NEXUS, QGSJET, SIBYLL, VENUS interaction models, experimental data shown according to Wiebel-Sooth and Jorg Horandel
Results method 1 method 2
Other muon spectra fits muon maximum energy spectrum All muon spectrum (SIBYLL)
Muon spectrum results • muon vertical flux at 1 TeV: • 1.03 10-10 cm-2 sr-1 s-1 GeV-1 • errors: • ± 0.07 (primary flux) • 0.02 (ice) • 0.04 (atm) • 0.06 (conf) • ± 0.02 (HE int. model) • Total: 1.03 ± 0.07
Why do different interaction models result in different flux?
Conclusions • Developed method depends weakly on ice parameters or • detector configuration • Cosmic ray flux corrections for both spectral index and • normalization are obtained. For QGSJET, γ=2.70±0.02, • and Φ0=0.106 ±0.007 m-2sr-1s-1TeV-1 (for H component). • Spectral index for muons depends on the interaction • model and is 2.66±0.02 for QGSJET • Muon flux at 1 TeV appears to be independent of high- • energy interaction model and for vertical muons is • 1.03±0.07 10-10 cm-2sr-1s-1GeV-1. • QGSJET, VENUS and NEXUS results agree best with • other experiments, but QGSJET is by far the fastest. • Insufficient accuracy in the description of multi-muon • events is the likely cause for disagreement between HE • interaction models
Fits to muon flux: corrected formula Simple formula: • Corrections: • cos* for curved atmosphere • muon energy losses • muon decay