Download

1 / 59
600 likes | 802 Vues
Environment & Ecology. 007 Human Population. Case study: China’s one-child policy. 1980. Human population growth: 7 billion. Human population growth: 7 billion. A few milestones that lead to our present population:. 10,000 bc agriculture 1500 new crops from Americas reach Europe

E N D
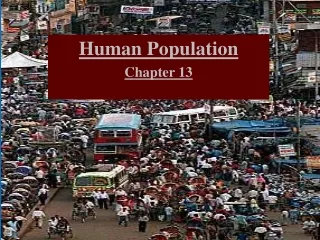
Environment & Ecology 007 Human Population
Human population growth: 7 billion A few milestones that lead to our present population: • 10,000 bc agriculture • 1500 new crops from Americas reach Europe • 1798 vaccinations • 1850 sewers were separated from drinking water, which was filtered and chlorinated • 1884 contraception • 1930 better nutrition, sanitation, health care • 1960 Green Revolution
The human population is still growing rapidly 1350 Agricultural Revolution Hunter/ Gatherer Industrial Revolution
Result of Large Populations pollution Greater need for resources starvation Reduction in biodiversity
World population has risen sharply “baby boom” • Global human population was <1 billion in 1800. • Population has doubled just since 1963. • We add 2.5 people every second (79 million/year).
United States birth rate (births per 1000 population) Baby boom 1946-1964 1939-1945 WWII 1909 1919 1929 1939 1949 1959 1969 1979 1989 1999 2009
Rates of growth vary from region to region • At today’s 1.2% global growth rate, the population will double in 58 years
Is population growth really a problem? • Population growth results from technology, medical care, sanitation, and food. • Death rates drop, but not birth rates. • Some people say growth is no problem. • New resources will replace depleted ones. • But some resources (i.e., biodiversity) are irreplaceable. • Quality of life will suffer with unchecked growth. • Less food, space, wealth per person
Some people fear falling populations • Population growth is correlated with poverty, not wealth. • Policymakers believe growth increases economic, political, and military strength. • They offer incentives for more children. • 67% of European nations think their birth rates are too low. • In non-European nations, 49% feel their birth rates are too high.
Environmental Impact Affluence per person (amt. of resources used per person) I = P A T Environmental effect of technologies (resources needed and wastes produced to obtain and consume resources) Number of people Population growth affects the environment IPAT Model • Measures 3 factors that affect environmental impact (I)
Affluence ~ Consumption (?) • A gold wedding ring ~ 3 tons of discharge at a mine in South Africa or the U.S. (47% of gold is recycled). • A gold watch ~ 10 to 20 tons. • Lunch with two quarter pounders • If animal was from Brazil, then 54 ft2 (~5 m2) of rain forest is gone, 59 lb of methane produced, ~200 gallons of water, 3.74 lb of grain • Hamburger bun required wheat, water, nitrogen fertilizer. • To build your car, it took 605,664 gallons of water for its steel parts and tires. Battery ~ 17.6 lbs of lead produces ~ 682 lbs of pollution at a mine in Australia or the U.S. (73% is recycled), Car has 22 lbs of copper produces ~2178 lbs of discharge somewhere in Chile or the U.S. (60% is recycled).
Population and the Environment • Population growth can lead to environmental degradation. Overpopulation in Africa’s Sahel region has led to overgrazing of semi-arid lands.
Demography studies human populations • Demography: the application of population ecology to the study of human populations • Population size • Density and distribution • Age structure, sex ratio • Birth, death, immigration, and emigration rates
Population size and density Predictions of population size depend on different assumptions about fertility rates.
Age Pyramid United States 2012 • The United States’ “baby boom” is evident in age bracket 40–50. U.S. age structure will change as baby boomers grow older.
Age structure: “Graying populations” • Demographers project that China’s population will become older over the next two decades. Figure 7.11a,b
Age structure: “Graying populations” • China’s aging population will mean fewer working-age citizens to finance social services for retirees. Figure 7.11c
China’s natural rate of change has fallen China’s rate has fallen with fertility rates. It now takes the population 4 times as long to double as it did 25 years ago.
Sex ratios • 100 females born to 106 males • China: 100 females born to 117 males
Population growth depends on various factors • Birth • Death • Immigration • Emigration • Technological advances led to dramatic decline in human death rates. • Widening the gap between birth rates and death rates resulting in population expansion
Migration can have environmental effects • Immigration and emigration play large roles today. Refugees from the 1994 Rwandan genocide endured great hardship, and deforested large areas near refugee camps.
Fertility rates affect population growth rates • Total fertility rate (TFR) = average number of children born per woman during her lifetime • Replacement fertility = the TFR that keeps population size stable • For humans, replacement fertility is about 2.1.
Factors affecting total fertility rate • Urbanization decreases TFR. • Access to medical care • Children attend school and impose economic costs • With social security, elderly parents need fewer children to support them. • Greater education allows women to enter the labor force, with less emphasis on child rearing.
The demographic transition • Refers to the transition from high birth and death rates to low birth and death rates as a country develops from a pre-industrial to an industrialized economic system.
Demographic transition: Stages • The demographic transition consists of several stages: • Pre-industrial stage: high death rates and high birth rates • Transitional stage: death rates fall due to rising food production and better medical care. Birth rates remain high, so population surges. • Industrial stage: birth rates fall, as women are employed and as children become less economically useful in an urban setting. Population growth rate declines. • Post-industrial stage: birth and death rates remain low and stable; society enjoys fruits of industrialization without threat of runaway population growth.
Is the demographic transition universal? • It has occurred in Europe, U.S., Canada, Japan, and other nations over the past 200-300 years. • But it may or may not apply to all developing nations. • Failure in transition could occur in cultures… • That place greater value on childbirth or • Grant women fewer freedoms For people to attain the material standard of living of North Americans, we would need the natural resources of four and a half more Earths.
Empowering women reduces growth rates • More educated women have fewer children.
Family planning and TFR • Family planning, health care, and reproductive education can lower TFRs. A counselor advises African women on health care and reproductive rights.
The International Conference on Population and Development • In 1994, in Cairo (Egypt), 179 nations called on all governments to offer universal access to reproductive health care within 20 years. • Offer better education and health care and alleviate poverty, disease, and sexism • From 1998 to 2001, the U.S. provided $46.5 million to the United Nations Population Fund for family planning efforts. • George W. Bush cancelled funding as one of his first acts on becoming U.S. president in 2001.
Wealth also produces environmental impacts • The population problem does not exist only within poor countries. • Affluent societies have enormous resource consumption and waste production. • People use resources from other areas, as well as from their own. • Individuals’ ecological footprints are huge. One American has as much environmental impact as 6 Chinese or 12 Indians or Ethiopians.
The Earth can’t support our consuming lifestyle Humanity’s global ecological footprint surpassed Earth’s capacity to support us in 1987.
Longevity Lowest: Africa (55 years) and developing Oceania (64) years) Mortality Rates in Long-Lived Populations Age Adjusted Death Rates (per 100,000 people) Rank* Location Life Expectancy Eating Pattern CHD** Cancer Stroke All Causes 1 Okinawa 81.2 East-West 18 97 35 335 2 Japan 79.9 Asian 22 106 45 364 3 Hong Kong 79.1 Asian 40 126 40 393 4 Sweden 79.0 Nordic 102 108 38 435 8 Italy 78.3 Mediterranean 55 135 49 459 10 Greece 78.1 Mediterranean 55 109 70 449 18 USA 76.8 American 100 132 28 520 * Average life expectancy world rank** Coronary Heart Disease
Conclusion • The human population is larger than at any time in the past. • Populations are still rising, even with decreasing growth rates. • Most developed nations have passed through the demographic transition. • Expanding rights for women slows population growth. • Will the population stop rising through the demographic transition, restrictive governmental intervention, or disease and social conflict caused by overcrowding and competition? • Sustainability requires a stabilized population in time to avoid destroying natural systems.
QUESTION: Review What has accounted for the majority of the world’s population growth in recent years? a) More women are having more babies. b) Death rates have dropped due to technology, medicine, and food. c) Fewer women are using contraceptives. d) More people are dying worldwide. e) Nothing. The population has dropped in recent years.
QUESTION: Review According to the I = P x A x T formula, what would happen if the U.S., with its consumptive lifestyle, increased its population to 1 billion people? • a) The population would automatically drop. • b) The population would automatically increase. • c) The impact on the environment would increase. • d) The impact on the environment would decrease. • e) The impact on the environment would even out.
QUESTION: Review How have humans been able to raise the environment’s carrying capacity for our species? a) Through technology b) By eliminating limiting factors c) Through increased consumption d) Spending more money on non-essential resources e) By formulating population policy guidelines