Download
1 / 13
140 likes | 348 Vues
WAVELET TRANSFORM. Torrence and Compo (1998). Convolution of time series x n with a scaled and translated version of a wavelet 0 ( ). Convolution needs to be effected N (# of points in time series) times for each scale s. Much faster to do the calculation in Fourier space.

E N D
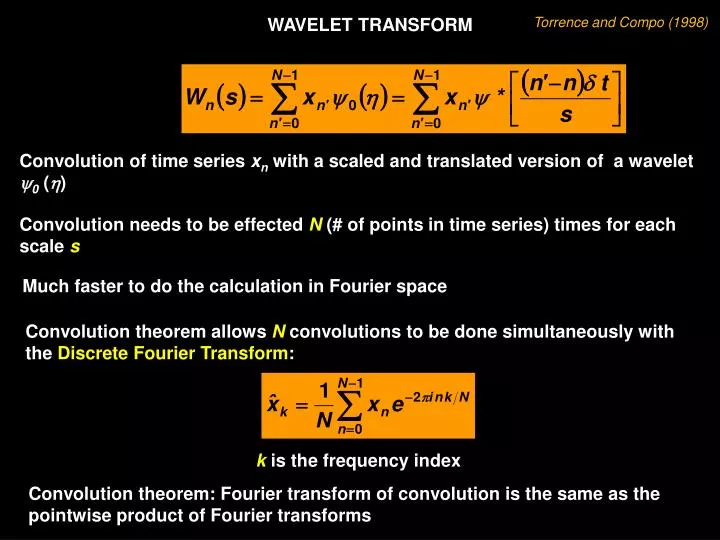
WAVELET TRANSFORM Torrence and Compo (1998) Convolution of time series xn with a scaled and translated version of a wavelet 0() Convolution needs to be effected N (# of points in time series) times for each scale s Much faster to do the calculation in Fourier space Convolution theorem allows N convolutions to be done simultaneously with the Discrete Fourier Transform: k is the frequency index Convolution theorem: Fourier transform of convolution is the same as the pointwise product of Fourier transforms
WAVELET TRANSFORM Fourier transform of Inverse Fourier transform of is Wn(s) With this relationship and a FFT routine, can calculate the continuous wavelet transform (for each s) at all n simultaneously
To ensure direct comparison from one s to the other, need to normalize wavelet function i.e. each unscaled wavelet function has been normalized to have unit energy and at each scale (N is total # of points): Wavelet transform is weighted by amplitude of Fourier coefficients and not by
Wavelet transform Wn(s) is complex because wavelet function is complex Wn(s) has real and imaginary parts that give the amplitude and phase and the wavelet power spectrum is |Wn(s)|2 for real the imaginary part is zero and there is no phase for white noise for all n and s Normalized wavelet power spectrum is
Seasonal SST averaged over Central Pacific Power relative to white noise
Considerations for choice of wavelet function: 1) Orthogonal or non-orthogonal: Non-orthogonal (like those shown here) are useful for time series analysis. Orthogonal wavelets – Haar, Daubechies 2) Complex or real: Complex returns information on amplitude and phase; better adapted for oscillatory behavior. Real returns single component; isolates peaks 3) Width (e-folding time of 0): Narrow function -- good time resolution Broad function – good frequency resolution 4) Shape: For time series with jumps or steps – use boxcar-like function (Haar) For smoothly varying time series – use a damped cosine (qualitatively similar results of wavelet power spectra).
Cone of Influence Morlet & DOG Paul
Relationship between Wavelet Scale and Fourier period Write scales as fractional powers of 2: smallest resolvable scale largest scale should be chosen so that the equivalent Fourier period is ~2 t j≤ 0.5 for Morlet wavelet; ≤ 1 for others N = 506 t = 0.25 yr s0= 2 t = 0.5 yr j = 0.125 J = 56 57 scales ranging from 0.5 to 64 yr
Relationship between Wavelet Scale and Fourier period Can be derived substituting a cosine wave of a known frequency into and computingsat which Wn is maximum
Seasonal SST averaged over Central Pacific How to determine the significance level?
Because the square of a normally distributed real variable is 2 distributed with 1 DOF At each point of the wavelet power spectrum, there is a 22 distribution For a real function (Mexican hat) there is a 12 distribution Distribution for the local wavelet power spectrum: Pk is the mean spectrum at Fourier frequency k, corresponding to wavelet scale s
SUMMARY OF WAVELET POWER SPECTRUM PROCEDURES 1) Find Fourier transform of time series (may need to pad it with zeros) 2) Choose wavelet function and a set of scales 3) For each scale, build the normalized wavelet function 4) Find wavelet transform at each scale 5) Determine cone of influence and Fourier wavelength at each scale 6) Contour plot wavelet power spectrum 7) Compute and draw 95% significance level contour